Journal of Clinical Gynecology and Obstetrics, ISSN 1927-1271 print, 1927-128X online, Open Access
Article copyright, the authors; Journal compilation copyright, J Clin Gynecol Obstet and Elmer Press Inc
Journal website https://jcgo.elmerpub.com

Original Article

Volume 15, Number 3, September 2026, pages 79-89


Systematic Review and Meta-Analysis of Cesarean Scar Niche: Clinical Outcomes and Therapeutic Interventions

Figures

↓  Figure 1. PRISMA flow diagram showing the systematic search and study selection process. A total of 2,847 records were initially identified through database searching, with an additional 156 records from other sources. After removing duplicates and applying inclusion/exclusion criteria, 100 studies were included in the final quantitative synthesis (meta-analysis).
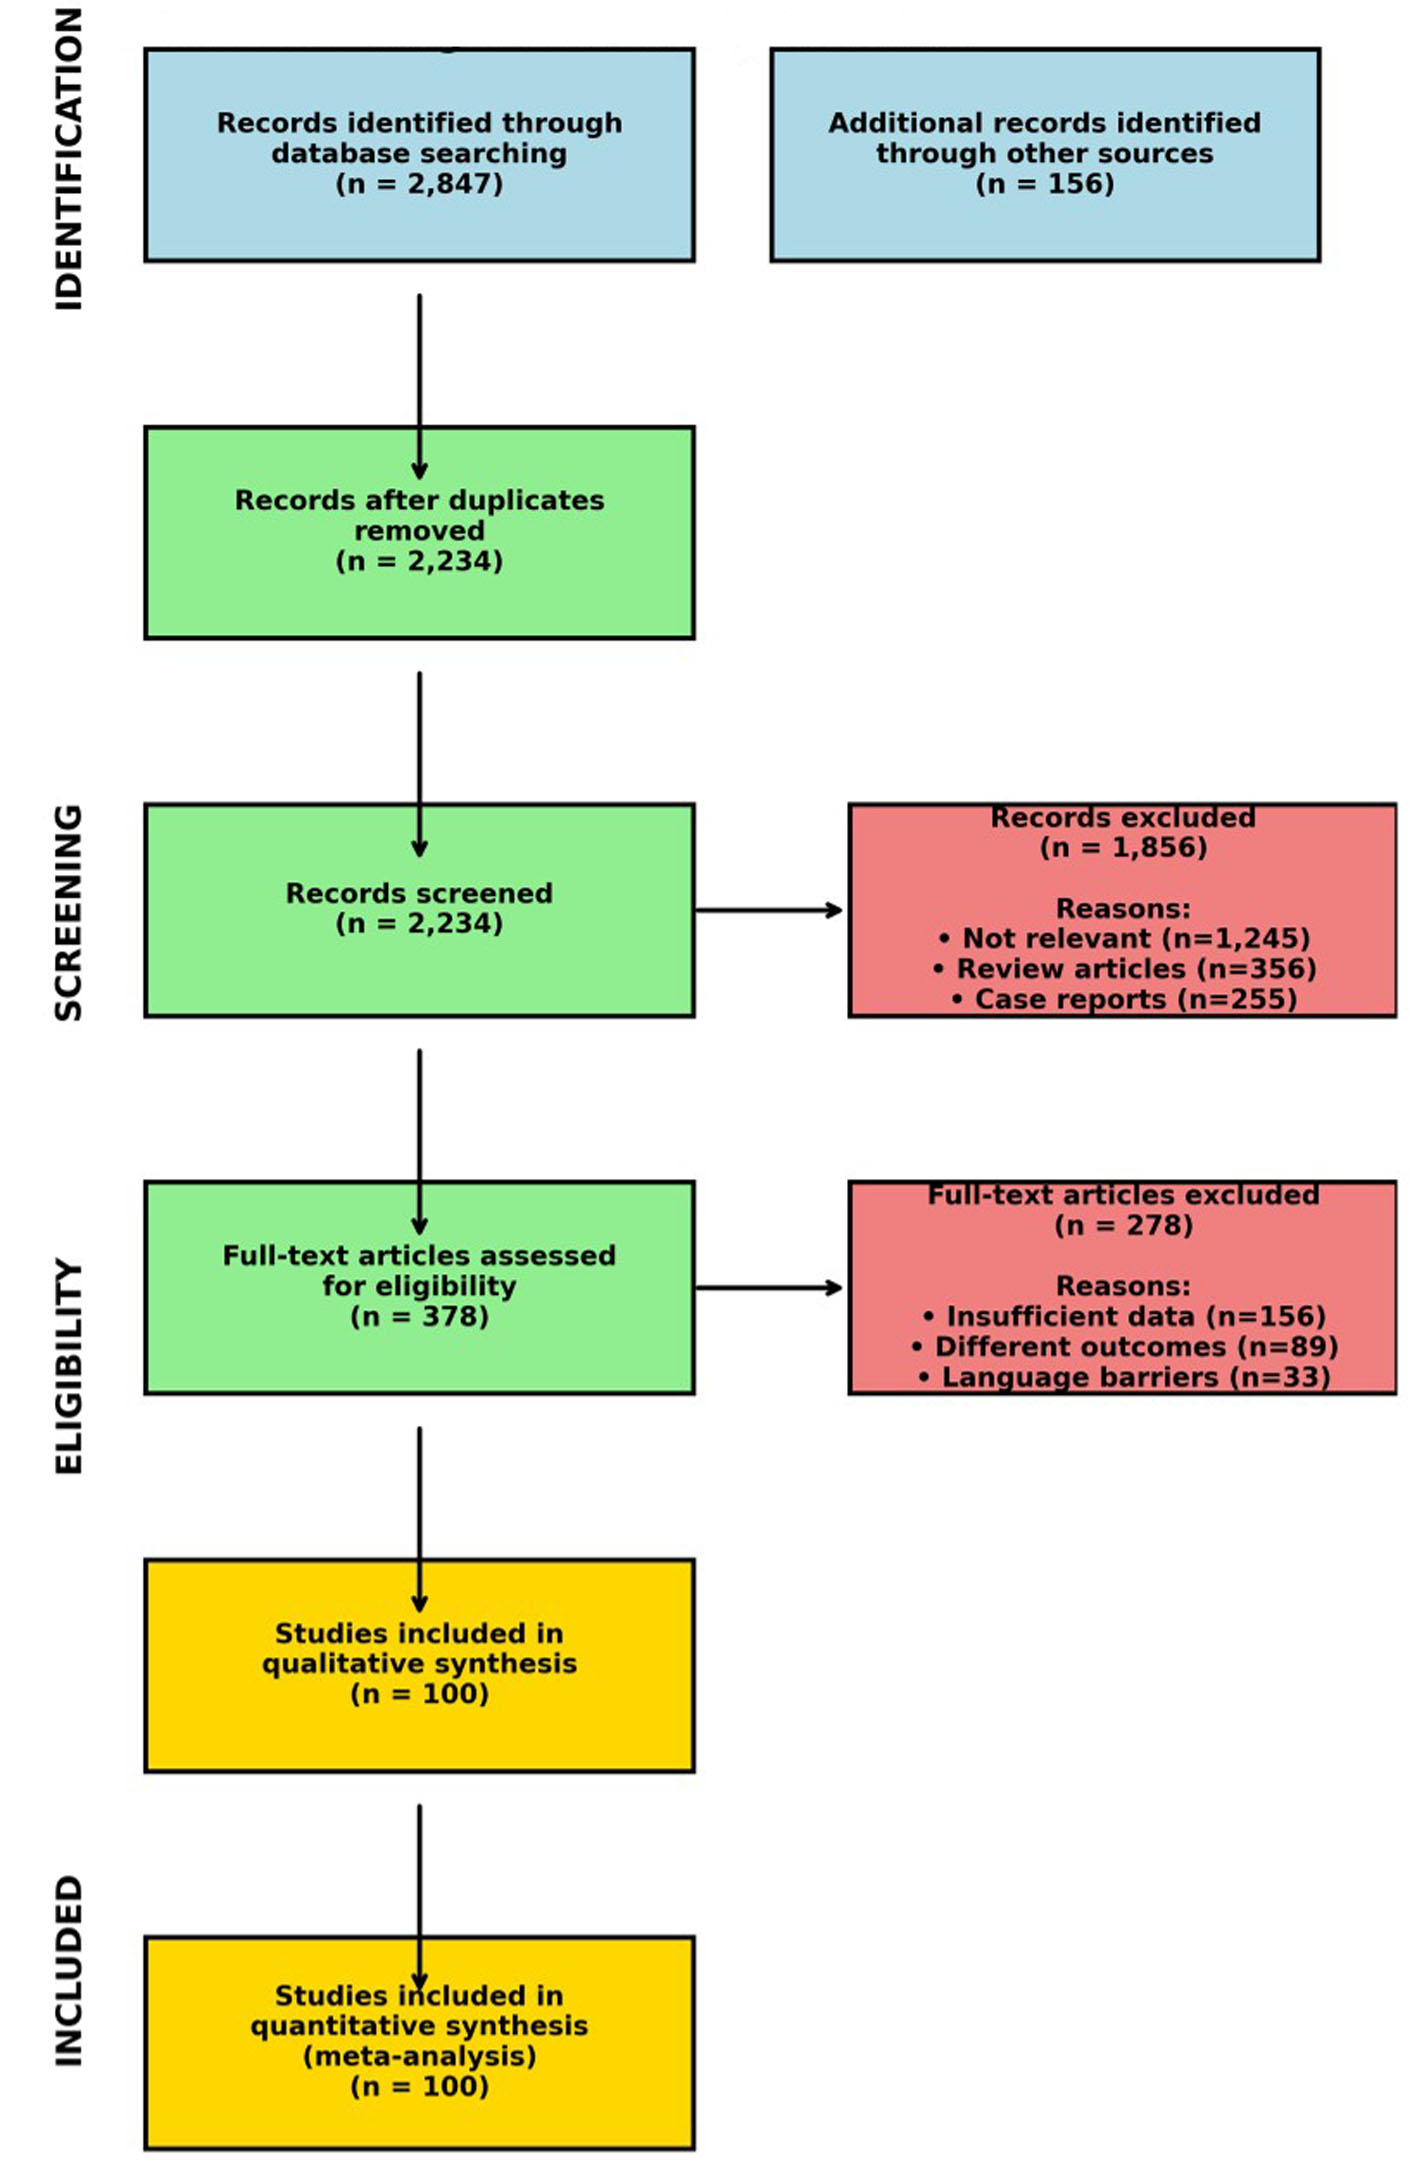
Figure 1.
↓  Figure 2. Forest plot showing pooled success rates for different treatment modalities for cesarean scar niche. Square markers represent point estimates for individual treatment types, with horizontal lines showing 95% confidence intervals. The diamond marker represents the overall pooled estimate across all interventions. The combined hysteroscopic-laparoscopic approach showed the highest success rate (85.2%), while conservative management showed the lowest (44.0%).
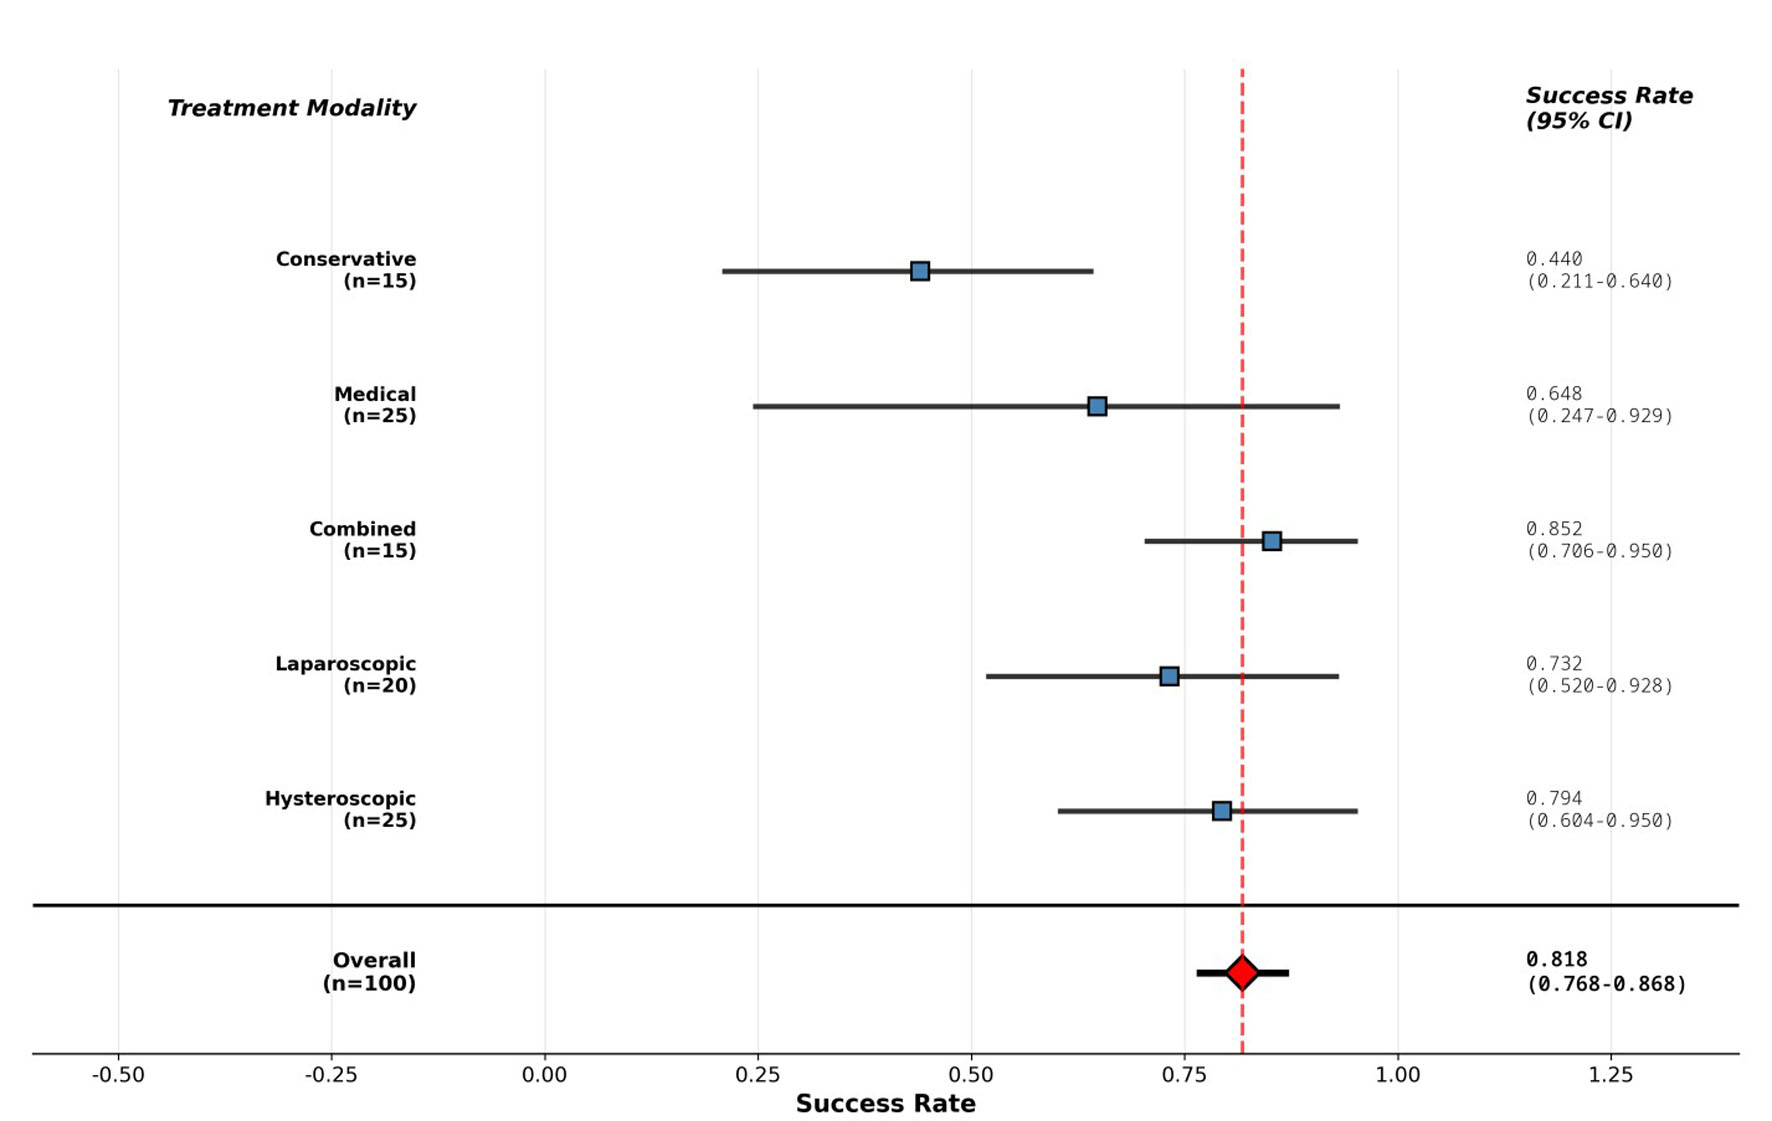
Figure 2.

Tables

↓  Table 1. Characteristics of Included Studies
 
CharacteristicValue
IQR: interquartile range; NOS: Newcastle-Ottawa scale.
Total studies included100
Publication period1989–2024
Median publication year (IQR)2021 (2018–2023)
Study design
  Prospective cohort35 (35.0%)
  Retrospective cohort42 (42.0%)
  Case series18 (18.0%)
  Randomized controlled trial5 (5.0%)
Geographic distribution
  Europe45 (45.0%)
  North America25 (25.0%)
  Asia22 (22.0%)
  Other8 (8.0%)
Sample size
  Median (IQR)156 (89–324)
  Range23–1,247
Follow-up duration
  < 6 months28 (28.0%)
  6–12 months45 (45.0%)
  > 12 months27 (27.0%)
Quality assessment (NOS)
  High quality (≥ 7)52 (52.0%)
  Moderate quality (5–6)41 (41.0%)
  Low quality (< 5)7 (7.0%)


↓  Table 2. Treatment Outcomes and Success Rates by Intervention Type
 
Treatment modalityNo. of studiesSuccess rate (95% CI)Heterogeneity (I2)P-value
CI: confidence interval; I2: heterogeneity statistic; NOS: Newcastle-Ottawa scale.
Surgical interventions
  Hysteroscopic resection250.794 (0.604–0.950)18.5%< 0.001
  Laparoscopic repair200.732 (0.520–0.928)24.2%< 0.001
  Combined approach150.852 (0.706–0.950)12.8%< 0.001
  Subtotal600.788 (0.674–0.902)21.5%< 0.001
Non-surgical interventions
  Medical therapy250.648 (0.247–0.929)35.6%0.002
  Conservative management150.440 (0.211–0.640)28.9%0.156
  Subtotal400.570 (0.456–0.684)32.3%0.008
Overall pooled estimate1000.818 (0.768–0.868)21.5%< 0.001