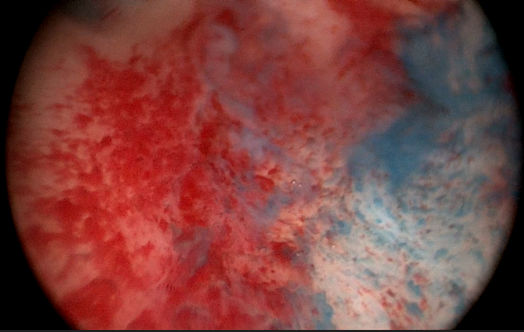
↓ Figure 1. Chromohysteroscopy: Methylene blue staining of pathologic endometrium.
| Journal of Clinical Gynecology and Obstetrics, ISSN 1927-1271 print, 1927-128X online, Open Access |
| Article copyright, the authors; Journal compilation copyright, J Clin Gynecol Obstet and Elmer Press Inc |
| Journal website https://jcgo.elmerpub.com |
Original Article
Volume 15, Number 2, June 2026, pages 62-68
Does Office Hysteroscopy Add Value in Polycystic Ovary Syndrome Patients With Normal Transvaginal Ultrasound Findings?
Figures
Tables
| Group A (n = 100) | Group B (n = 50) | P value | |
|---|---|---|---|
| BMI: body mass index; SD: standard deviation. | |||
| Age (years), mean ± SD | 28.94 ± 4.62 | 26.86 ± 3.71 | 0.224 |
| Weight (kg), mean ± SD | 73.33 ± 11.66 | 67.36 ± 12.50 | < 0.005 |
| Height (cm), mean ± SD | 158.17 ± 28.5 | 161.30 ± 6.98 | 0.447 |
| BMI (kg/m2), mean ± SD | 27.51 ± 3.53 | 25.80 ± 4.03 | < 0.008 |
| Education | |||
| Illiterate | 41 (41.0%) | 23 (46.0%) | |
| Primary school | 23 (23.0%) | 14 (28.0%) | 0.665 |
| Secondary school | 27 (27.0%) | 11 (22.0%) | |
| High level | 9 (9.0%) | 2 (4.0%) | |
| Infertility | |||
| Primary | 72 (72.0%) | 33 (66.0%) | 0.284 |
| Secondary | 28 (28.0%) | 17 (34.0%) | |
| Medication | |||
| No | 87 (87.0%) | 50 (100%) | |
| Metformin 850 mg XR (sustained release) | 5 (5.0%) | 0 | < 0.01 |
| Metformin 500 mg | 5 (5.0%) | 0 | |
| Clomiphene citrate | 3 (3.0%) | 0 | |
| Parity | |||
| 0 | 72 (72.0%) | 33 (66.0%) | |
| 1 | 15 (15.0%) | 13 (26.0%) | 0.434 |
| 2 | 11 (11.0%) | 3 (6.0%) | |
| 3 | 2 (2.0%) | 1 (2.0%) | |
| Duration of infertility, mean ± SD | 4.87 ± 2.39 | 4.25 ± 2.43 | 0.139 |
| Group A (n = 100) | Group B (n = 50) | P value | |
|---|---|---|---|
| TSH: thyroid-stimulating hormone; FSH: follicle-stimulating hormone; LH: luteinizing hormone; SD: standard deviation. | |||
| TSH, mean ± SD | 2.88 ± 1.56 | 2.75 ± 1.1 | 0.621 |
| Prolactin, mean ± SD | 13.19 ± 6.11 | 12.25 ± 6.31 | 0.388 |
| LH, mean ± SD | 8.85 ± 3.015 | 4.94 ± 2.29 | < 0.000 |
| FSH, mean ± SD | 7.34 ± 3.35 | 5.82 ± 2.24 | < 0.001 |
| Group A (n = 100) | Group B (n = 50) | P value | |
|---|---|---|---|
| Cervical canal | |||
| Normal | 91 (91.0%) | 47 (94.0%) | 0.495 |
| Thick mucosal secretion | 6 (6.0%) | 3 (6.0%) | |
| Ectopy (ectocervix) | 3 (3.0%) | 0 | |
| Endometrium | |||
| Normal | 94 (94.0%) | 46 (92.0%) | |
| Thin | 4 (4.0%) | 4 (8.0%) | 0.569 |
| Focal lesions | |||
| Micropolyps | 1 (1.0%) | 0 | |
| Morphological anomalies | |||
| Subseptate uterus | 1 (1.0%) | 0 | |
| Endometrial vasculature | |||
| Normal | 89 (89.0%) | 42 (84.0%) | |
| Pale | 7 (7.0%) | 7 (14.0%) | 0.325 |
| Congested | 4 (4.0%) | 1 (2.0%) | |
| Darwish triad | |||
| Normal | 94 (94%) | 76 (92%) | 0.325 |
| Intratubal micropolyps | 6 (6%) | 4 (8%) |
| Group A (n = 100) | Group B (n = 50) | P value | |
|---|---|---|---|
| Proliferative endometrium | 76 (76.0%) | 42 (84.0%) | |
| Chronic endometritis | 7 (14%) | 4 (8%) | |
| Distorted proliferative endometrium | 8 (16%) | 0 | 0.239 |
| Microscopic polypi | 7 (7.0%) | 4 (8.0%) | |
| Simple hyperplasia | 2 (2%) | 0 |
| Group A (n = 100) | Group B (n = 50) | |
|---|---|---|
| PPV: positive predictive value; NPV: negative predictive value. | ||
| Sensitivity | 100% | 93.50% |
| Specificity | 100% | 100% |
| PPV | 94% | 91.48% |
| NPP | 0 | 6.50% |