Journal of Clinical Gynecology and Obstetrics, ISSN 1927-1271 print, 1927-128X online, Open Access
Article copyright, the authors; Journal compilation copyright, J Clin Gynecol Obstet and Elmer Press Inc
Journal website https://jcgo.elmerpub.com

Original Article

Volume 15, Number 1, March 2026, pages 24-29


The Relationship Between Branched-Chain Amino Acid Levels and Gestational Diabetes Mellitus in Low-Risk Pregnant Women

Figure

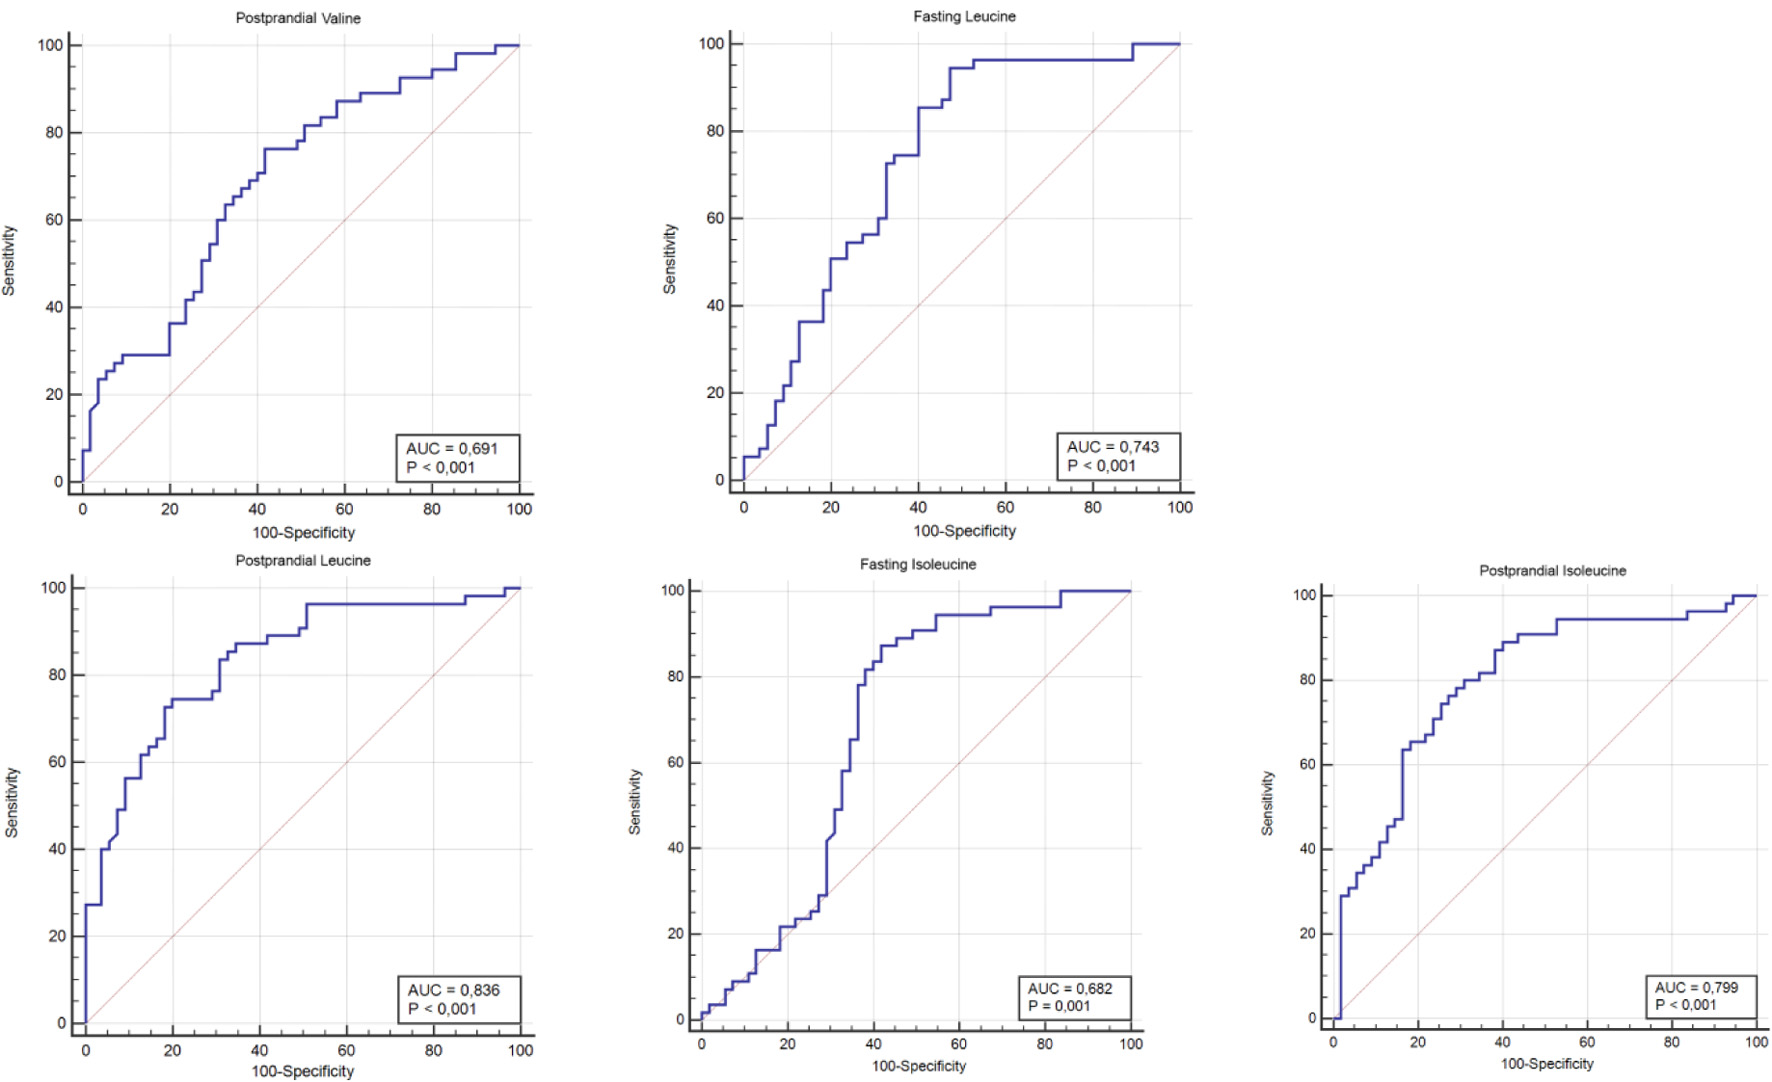
↓  Figure 1. The ROC curve of postprandial valine, fasting leucine, postprandial leucine, fasting isoleucine, and postprandial isoleucine values for gestational diabetes mellitus. ROC: receiver operating characteristic.
Figure 1.

Tables

↓  Table 1. Comparison of the Sociodemographic Characteristics Between Groups
 
GDM, n (%) Control, n (%) Pa
aChi-square analysis was applied. GDM: gestational diabetes mellitus.
Education level 0.323
  Primary school 7 (12.7) 2 (3.6)
  Middle school 2 (3.6) 4 (7.3)
  High school 26 (47.3) 26 (47.3)
  University 20 (36.4) 23 (41.8)
Profession 0.158
  Works 15 (27.3) 22 (40.0)
  Housewife 40 (72.7) 33 (60.0)
Surgical history 0.140
  Yes 9 (16.4) 4 (7.3)
  No 46 (83.6) 51 (92.7)
Smoker 0.541
  Yes 5 (9.1) 7 (12.7)
  No 50 (90.9) 48 (87.3)
Pregnancy week 0.614
  24 5 (9.1) 8 (14.5)
  25 15 (27.3) 18 (32.7)
  26 10 (18.2) 12 (21.8)
  27 16 (29.1) 11 (20.0)
  28 9 (16.4) 6 (10.9)


↓  Table 2. Comparison of the Anthropometric Characteristics Between Groups
 
GDM, median Control, median P
aStudent’s t-test was applied. bMann-Whitney U test was applied. BMI: body mass index; GDM: gestational diabetes mellitus.
Age 28.3 ± 4.3 27.6 ± 5.3 0.494a
Pre-pregnancy weight 60.2 ± 9.6 61.2 ± 10.5 0.601a
Weight during test 68.0 ± 8.6 67.7 ± 8.7 0.838a
Height 161.6 ± 5.9 162.5 ± 5.2 0.745b
BMI 26.0 ± 2.6 25.6 ± 2.8 0.568b


↓  Table 3. Comparison of Fasting and Postprandial Amino Acid Values Between Groups
 
GDM, median (µmol/L) Control, median (µmol/L) P
aStudent’s t-test was applied. bMann-Whitney U test was applied. A P-value < 0.05 was considered statistically significant, indicating that the observed differences were unlikely to have occurred by chance. GDM: gestational diabetes mellitus.
Fasting valine 154.6 ± 28.7 154.7 ± 32.3 0.990a
Postprandial valine 168.5 ± 46.8 138.5 ± 35.9 0.001b
Fasting leucine 82.9 ± 16.1 67.4 ± 18.7 < 0.001a
Postprandial leucine 95.3 ± 34.2 57.7 ± 21.4 < 0.001b
Fasting isoleucine 44.5 ± 9.7 37.7 ± 13.6 0.003a
Postprandial isoleucine 51.8 ± 19.2 34.6 ± 28.0 < 0.001b


↓  Table 4. Specificity and Sensitivity of Amino Acids in Determining the Diagnosis of GDM
 
Area P 95% CI Sensitivity Specificity PPV NPV
A P-value < 0.05 was considered statistically significant, indicating that the observed differences were unlikely to have occurred by chance. CI: confidence interval; GA: glycine alanine; GDM: gestational diabetes mellitus; NPV: negative predictive value; PPV: positive predictive value.
Fasting valine ≤ 117.54 0.503 0.962 0.406–0.599 5.5 83.6 25 46.9
Postprandial valine > 138.64 0.691 < 0.001 0.596–0.776 76.4 58.2 64.6 71.1
Fasting leucine > 61.18 0.743 < 0.001 0.651–0.821 94.5 52.7 66.7 90.6
Postprandial leucine > 74.91 0.836 < 0.001 0.753–0.899 74.5 80 78.8 75.9
Fasting isoleucine > 36.32 0.682 0.001 0.587–0.768 87.3 58.2 67.6 82.1
Postprandial isoleucine > 37.95 0.799 < 0.001 0.712–0.870 80 69.1 72.1 77.6