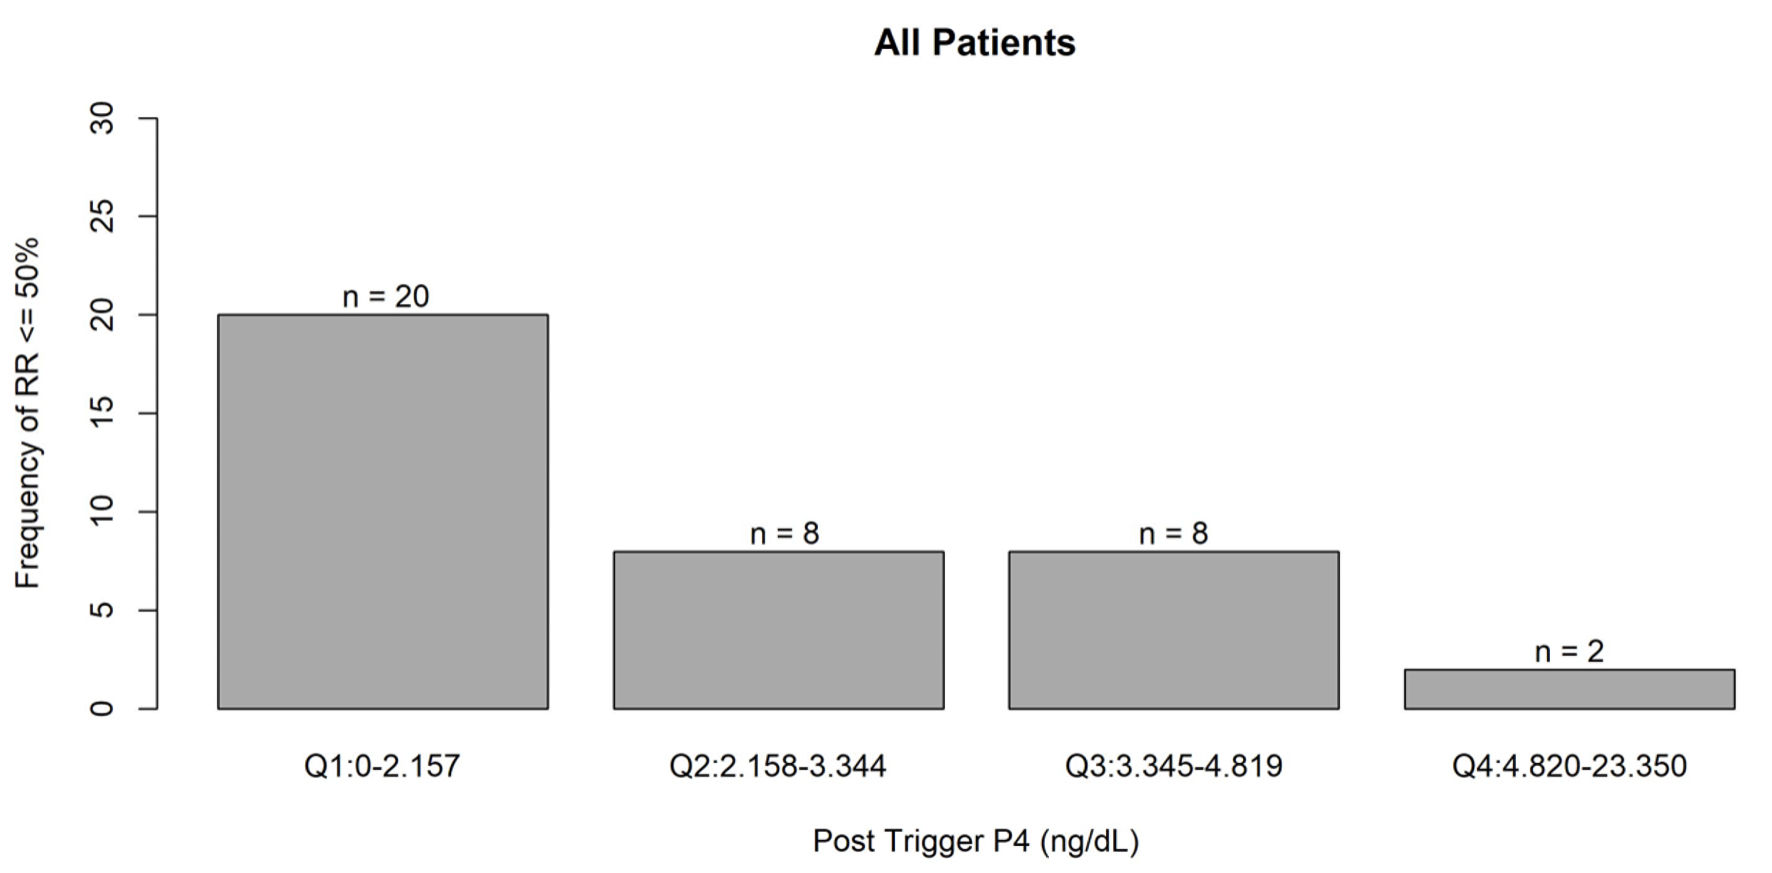
↓ Figure 1. Frequency of recovery rate ≤
50% associated with post-trigger progesterone levels. Q1: quartile 1; Q2: quartile 2; Q3: quartile 3;
Q4: quartile 4; P4: progesterone.
| Journal of Clinical Gynecology and Obstetrics, ISSN 1927-1271 print, 1927-128X online, Open Access |
| Article copyright, the authors; Journal compilation copyright, J Clin Gynecol Obstet and Elmer Press Inc |
| Journal website https://jcgo.elmerpub.com |
Original Article
Volume 15, Number 1, March 2026, pages 30-37
Association Between Post-Trigger Hormones and In Vitro Fertilization Cycle Outcomes
Figures
Tables
| All cycles (n = 320) | |
|---|---|
| BMI: body mass index; SD: standard deviation. | |
| Age (years) | |
| Range | 25–48 |
| Mean (SD) | 37.6 (4.1) |
| BMI | |
| Range | 17.54–70.52 |
| Mean (SD) | 27.7 (8.1) |
| Race/ethnicity, n (%) | |
| African American | 15 (4.7) |
| Asian | 39 (12.2) |
| Caucasian | 95 (29.7) |
| Hispanic | 34 (10.6) |
| Unknown | 137 (42.8) |
| Number of oocytes retrieved | |
| Range | 1–47 |
| Mean (SD) | 11.0 (7.5) |
| Oocyte recovery rate (proportion) | |
| Range | 0.23–2 |
| Mean (SD) | 0.9 (0.3) |
| Number of mature oocytes | |
| Range | 0–30 |
| Mean (SD) | 7.2 (5.1) |
| Oocyte maturity rate (proportion) | |
| Range | 0–1 |
| Mean (SD) | 0.7 (0.2) |
| Number of fertilized oocytes | |
| Range | 0–25 |
| Mean (SD) | 6.2 (4.4) |
| Median (Q1, Q3) | 6 (3, 8) |
| Oocyte fertilization rate (proportion) | |
| Range | 0–1 |
| Mean (SD) | 0.9 (0.1) |
| Number of blastocysts | |
| Range | 0–16 |
| Mean (SD) | 2.9 (3.0) |
| Blastulation rate (proportion) | |
| Range | 0–1 |
| Mean (SD) | 0.5 (0.3) |
| All cycles (n = 320) | |
|---|---|
| aN = 223. IVF: in vitro fertilization. | |
| Oocyte recovery rate ≤ 50%, n (%) | |
| No | 282 (88.1) |
| Yes | 38 (11.9) |
| Oocyte maturity rate ≤ 40%, n (%) | |
| No | 295 (92.2) |
| Yes | 25 (7.8) |
| Fertilization rate ≤ 75%, n (%) | |
| No | 262 (81.9) |
| Yes | 55 (17.2) |
| Not applicable | 3 (0.9) |
| Blastulation rate ≤ 20% (4+ fertilized), n (%)a | |
| No | 172 (77.1) |
| Yes | 51 (22.9) |