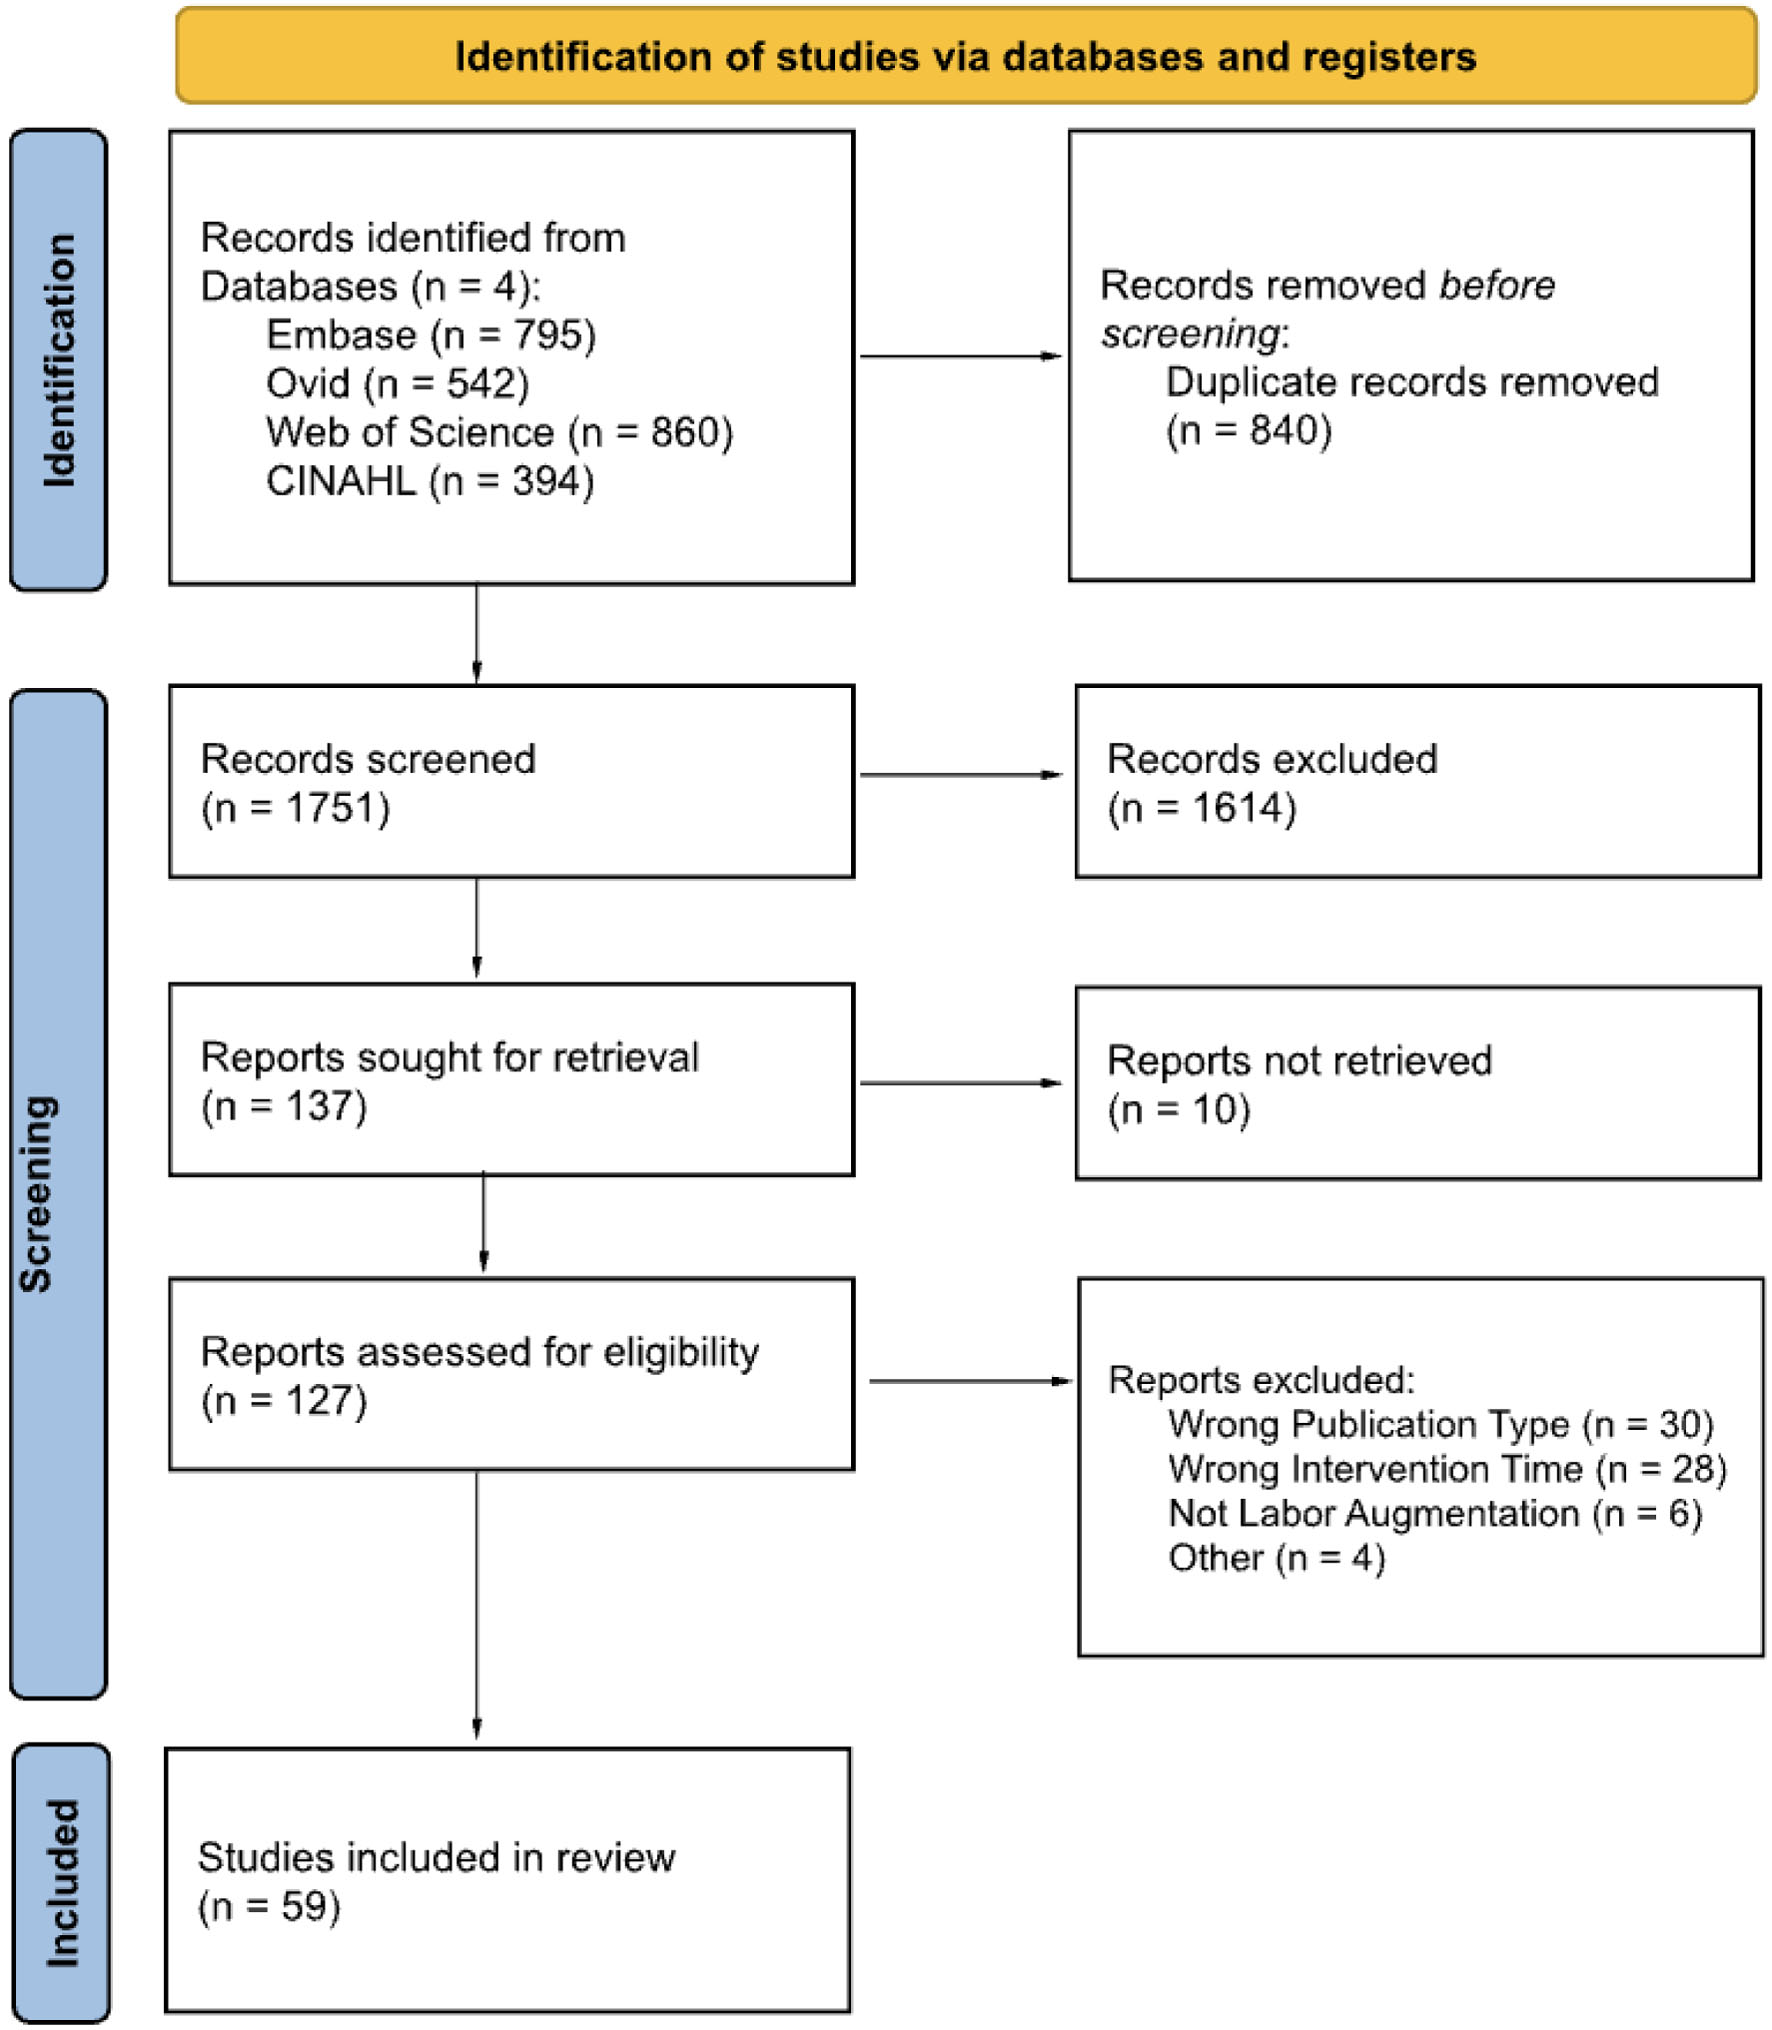
↓ Figure 1. PRISMA diagram. Adapted from Ref. [3].
| Journal of Clinical Gynecology and Obstetrics, ISSN 1927-1271 print, 1927-128X online, Open Access |
| Article copyright, the authors; Journal compilation copyright, J Clin Gynecol Obstet and Elmer Press Inc |
| Journal website https://jcgo.elmerpub.com |
Original Article
Volume 15, Number 3, September 2026, pages 97-113
Exploring Traditional Labor Practices: The Efficacy and Safety of Wives’ Tales Methods for Labor Induction and Augmentation
Figure
Tables
| Study characteristics | Inclusion criteria | Exclusion criteria |
|---|---|---|
| Population | Pregnant patients with delivery during third trimester Intervention initiated prior to labor and occurred in the third trimester | Intervention occurred before third trimester Intervention initiated during labor Non-human subjects |
| Context | Discusses “wives’ tales” methods to augment labor in the setting of pregnancy | Does not discuss “wives’ tales” methods to augment labor in the setting of pregnancy Only discusses pain management in labor |
| Publication year | On or after 2005 | Before 2005 |
| Study design | Randomized controlled trials, cohort, case control, cross sectional, retrospective chart reviews, case series > 5 participants | Literature reviews, scoping reviews, meta-analyses, editorials, case reports, case series < 5 participants |
| Language | English | Non-English |
| Study | Groups | Labor Initiation | Timing | Secondary findings |
|---|---|---|---|---|
| Labor initiation: rate of spontaneous labor or rate of requiring induction; Timing: duration of intervention to labor onset or intervention to delivery of newborn; IG: intervention group; CG: control group. | ||||
| Ajori et al (2013) [5] | IG: Acupressure CG: Sham acupressure | Spontaneous labor: IG: 94.7% CG: 89.2% P = 0.430 | Intervention to delivery: IG: 7.76 ± 6.84 days CG: 9.46 ± 5.97 days P = 0.066 | Delivery method: Rate of vaginal delivery: P = 0.191 |
| Alsharnoubi et al (2015) [6] | IG: Laser acupuncture CG: Sham laser | Spontaneous labor: IG: 66.7% CG: 26.7% P = 0.002 | - | Delivery method: Higher rate of vaginal delivery in IG: P = 0.002 |
| Asher et al (2009) [7] | IG: TCM acupuncture CG: Sham acupuncture | Spontaneous labor: IG: 67% CG: 69% P = 0.66 | Intervention to delivery: IG: 9.3 ± 2.2 days CG: 11.9 ± 2.2 days P = 0.066 | Delivery method: Rate of cesarean section: P = 0.37 |
| Cole (2017) [8] | IG: Electroacupuncture CG: None | Required induction: IG: 0% | Intervention to delivery: Less than 26 h after first treatment IG: 37.5% | - |
| Gaudet et al (2008) [9] | IG: Acupressure CG: Sham acupressure | Required induction: IG: 66% CG: 71% P = 0.42 | Intervention to delivery: IG: 146 h CG: 208 h P = 0.070 | Labor duration: P = 0.14 |
| Gregson et al (2015) [10] | IG: Acupressure CG: Sham treatment | Required induction: IG: 41% CG: 24% P = 0.04 | Intervention to labor: IG: 103 h CG: 72 h P = 0.19 | Delivery method: Rate of vaginal delivery: P = 0.90 |
| Gribel et al (2011) [11] | IG: Electroacupuncture CG: Misoprostol | Spontaneous labor: IG: 42.9% CG: 40.6% P = 0.28 | - | Delivery method: Higher rate of vaginal delivery in IG: P = 0.01 Labor duration: Longer in IG: P = 0.03 |
| Harper et al (2006) [12] | IG: Acupuncture CG: Standard care | Spontaneous labor IG: 70% CG: 50% P = 0.12 | Intervention to delivery: IG: 124 ± 86.7 h CG: 145 ± 82.7 h P = 0.36 | Delivery method: Rate of cesarean section: P = 0.07 |
| Koh et al (2019) [13] | IG: CAM (acupressure/reflexology) CG: Standard care | Required induction: Nulliparous patients IG: 44% CG: 42% P = 0.52 | Intervention to labor: IG: 17.2 h CG: 14.6 h P = 0.009 Intervention to delivery: IG: 23.8 CG: 21.2 P = 0.0001 | Labor duration: 3.2 h longer in IG: P = 0.0001 |
| Lokugamage et al (2020) [14] | IG: Acupuncture CG: Standard care | Required induction: P = 0.29 | - | - |
| McCullough et al (2017) [15] | IG: Reflexology CG: Standard care | Required induction: IG: 41.7% CG: 36% P = 0.986 | - | Delivery method: Rate of vaginal delivery: P = 0.716 Second stage duration: Significantly reduced in IG: P < 0.05 |
| Modlock et al (2010) [16] | IG: Acupuncture CG: Sham acupuncture | Spontaneous labor: IG: 11.7% CG: 13.8% P = 0.79 | - | Cervical dilation: P = 0.90 Labor duration: P = 0.38 First stage duration: P = 0.51 Second stage duration: P = 0.52 |
| Mollart et al (2016) [17] | IG: Acupressure CG: Standard care | Spontaneous labor: IG: 50% CG: 40.9% P = 0.37 | - | Delivery method: Rate of vaginal delivery: P = 0.48 |
| Neri et al (2014) [18] | IG: Acupuncture CG: Standard care | Required induction: IG: 20% CG: 17% P > 0.05 | - | - |
| Neri et al (2018) [19] | IG: Acupuncture CG: Standard care | Spontaneous labor: IG: 75% CG: 52.8% P < 0.01 | - | Delivery method: Rate of cesarean section: P > 0.05 |
| Smith et al (2008) [20] | IG: Acupuncture CG: Sham acupuncture | Spontaneous labor: IG: 28.2% CG: 57% P = 0.83 | - | Bishop score: P = 0.34 |
| Teimoori et al (2014) [21] | IG: Shiatsu CG: Standard care | Spontaneous labor: IG: 56.9% CG: 8.3% P < 0.001 | Intervention to labor: IG: 25.5 h CG: 9.9 h P > 0.05 | Delivery method: Rate of vaginal delivery: P = 0.207 Labor duration: P > 0.05 First stage duration: P > 0.05 Second stage duration: P > 0.05 |
| Torkzahrani et al (2015) [22] | IG: Acupressure CG: Standard care | - | - | Bishop score: Greater improvement within 48 h in IG: P = 0.012 Delivery method: Rate of vaginal delivery: P = 0.726 |
| Torkzahrani et al (2017) [23] | IG: Acupressure CG: Sham acupressure | Spontaneous labor: < 48 h IG: 30% CG: 20% P = 0.464 | Intervention to delivery: IG: 124.88 ± 75.93 h CG: 135.39 ± 70.09 h P = 0.565 | - |
| Study | Labor initiation | Timing | Delivery method | Gestational age | Labor duration |
|---|---|---|---|---|---|
| Labor initiation: rate of spontaneous labor or rate of requiring induction; Timing: percent of patients with labor onset within 24 h of intervention; Gestational age: gestational age of baby at time of delivery; Labor duration: in hours; IG: intervention group; CG: control group; NSVD: normal spontaneous vaginal delivery; VBAC: vaginal birth after cesarean section; C-sec: cesarean section; RLTCS: repeat low-transverse cesarean section. | |||||
| Azhari et al (2006) [25] | Spontaneous labor: IG: 54.2% CG 4.3% P < 0.001 | - | IG - NSVD: 79.2% CG - NSVD: 52.2% P > 0.05 | - | - |
| Bayoumi et al (2022) [26] | Required induction: IG: 26.9% CG: 26.3% P = 0.5 | IG: 45.7% CG: 8.6% P < 0.001 | IG - VBAC: 65.7% IG - RLTCS: 34.3% CG - VBAC: 48.6% CG - RLTCS: 51.4% P (VBAC) = 0.1 P (RLTCS) = 0.1 | IG: 39.4 ± 0.4 weeks CG: 39.8 ± 0.3 weeks P < 0.001 | IG stage 1: 7.9 ± 2.4 IG stage 2: 0.9 ± 0.5 CG stage 1: 8.4 ± 2.3 CG stage 2: 1 ± 0.4 P (stage 1) = 0.5 P (stage 2) = 0.5 |
| Boel et al (2009) [27] | Required induction: IG: 9.3% CG: 7.6% P > 0.05 | IG: 18.6% CG: 19.9% P > 0.05 | IG - C-sec: 1.2% CG - C-sec: 1.4% P > 0.05 | - | - |
| DeMaria et al (2018) [28] | Spontaneous labor: IG total: 67.8% CG: none | - | IG - NSVD: 90.7% IG - C-sec: 9.2% P (NSVD) = 0.01 P (C-sec) < 0.01 | - | IG stage 1: 8.6 ± 5.8 IG stage 2: 1.5 ± 1.4 IG stage 3: 11.2 ± 5.4 |
| Gilad et al (2018) [29] | - | IG: 42.1% CG: 34.9% P = 0.16 | IG - C-sec: 16.2% CG - C-sec: 9.1% P = 0.332 | IG: 284.9 days CG: 284.7 days P = 0.86 | - |
| Neri et al (2018) [30] | Required induction: IG: 45% CG: 90% P < 0.001 | IG: 47.5% CG: N/A | IG - NSVD: 47.5% IG - C-sec: 20% CG - NSVD: 7.5% CG - C-sec: 37.5% P (NSVD) < 0.001 P (C-sec) > 0.05 | IG: 287.8 ± 6.0 days CG: 298.9 ± 3.9 days P > 0.05 | - |
| Study | Groups | Labor initiation | Labor duration | Delivery method |
|---|---|---|---|---|
| Labor initiation: rate of spontaneous labor or rate of requiring induction; IG: intervention group; CG: control group; NSVD: normal spontaneous vaginal delivery; C-sec: cesarean section. | ||||
| Baena-García et al (2023) [33] | IG: Exercise CG: Standard | Required induction: IG: 29.2% CG: 32.3% P = 0.54 | IG - stage 1: 241.9 ± 172.4 min IG - stage 2: 93 ± 65.4 min CG - stage 1: 202 ± 137.2 min CG - stage 2: 95.7 ± 69.2 min P (stage 1) = 0.26 P (stage 2) = 0.93 | IG - NSVD: 61.2% IG - C-sec: 18.4% CG - NSVD: 57.7% CG - C-sec: 29.6% P (ALL) = 0.46 |
| Barakat et al (2018) [34] | IG: Exercise CG: None | Spontaneous labor: IG: 79.0% CG: 77.2% P = 0.69 | IG - stage 1: 409.15 ± 185.74 min IG - stage 2: 33.23 ± 22.53 min CG - stage 1: 462.83 ± 208.37 min CG - stage 2: 36.21 ± 25.93 min P (stage 1) = 0.01 P (stage 2) = 0.68 | - |
| Bolanthakodi et al (2018) [35] | IG: Yoga CG: None | Required induction: IG: 17.33% CG: 36% P = 0.044 | IG - stage 1: 10.13 h IG - stage 2: 0.96 h IG - total: 11.26 h CG - stage 1: 11.95 h CG - stage 2: 1.04 h CG - total: 13.18 h P (stage 1) < 0.001 P (stage 2) = 0.31 P (total) < 0.001 | IG - NSVD: 82.66% IG - C-sec: 10.66% CG - NSVD: 68% CG - C-sec: 22.66% P (NSVD) = 0.037 P (C-sec) = 0.048 |
| Ferreira et al (2019) [36] | IG: Exercise CG: Standard | Required induction: IG: 20.2% CG: 34.0% P = 0.003 | IG - active phase: 2.9 ± 2.0 h IG - stage 2: 35.8 ± 35.6 min CG - active phase: 3.1 ± 2.1 h CG - stage 2: 33.4 ± 21 min P (active phase) = 0.584 P (stage 2) = 0.701 | IG - C-sec: 27.3% CG - C-sec: 32.1% P (C-sec) = 0.418 |
| Ghandali et al (2021) [37] | IG: Pilates CG: Standard | - | IG - active phase: 110 ± 70.94 min IG - stage 2: 33.49 ± 24.51 min CG - active phase: 164 ± 99.81 min CG - stage 2: 50.36 ± 38.59 min P (active phase) = 0.61 P (stage 2) = 0.52 | IG - NSVD: 88.2% IG - C-sec: 11.8% CG - NSVD: 80.8% CG - C-sec: 19.2% P (ALL) = 0.296 |
| Haakstad et al (2020) [38] | IG: Exercise CG: Standard | Required induction: IG: 11.5% CG: 5.7% P = 0.291 | IG - active phase: 9.5 ± 6.7 h IG - stage 2: 51.2 ± 31.9 min CG - active phase: 9.8 ± 5.4 h CG - stage 2: 49.3 ± 27.1 min P (active phase) = 0.029 P (stage 2) = 0.987 | IG - NSVD: 69.2% IG - C-sec: 9.6% CG - NSVD: 62.3% CG - C-sec: 22.6% P (NSVD) = 0.051 P (C-sec) = 0.197 |
| Maharana et al (2013) [39] | IG: Yoga CG: Standard | Required induction: IG: 5% CG: 11% P > 0.05 | IG - stage 1: 283.62 ± 35.11 min IG - stage 2: 23.41 ± 7.68 min CG - stage 1: 371.11 ± 47.17 min CG - stage 2: 55.19 ± 10.87 min P (stage 1) = 0.001 P (stage 2) = 0.001 | IG - NSVD: 86% IG - C-sec: 14% CG - NSVD: 60% CG - C-sec: 40% P (NSVD) = 0.23 P (C-sec) = 0.17 |
| Perales et al (2016) [40] | IG: Exercise CG: Standard | - | IG - stage 1: 399.1 ± 322.1 min IG - stage 2: 40.6 ± 42.8 min CG - stage 1: 537.4 ± 409.3 min CG - stage 2: 37.4 ± 44.7 min P (stage 1) = 0.01 P (stage 2) = 0.87 | IG NSVD: 83.1% CG NSVD: 85.5% P (ALL) = 0.66 |
| Pereira et al (2022) [41] | IG: Exercise CG: Standard | Required induction: IG: 17.5% CG: 33.3% Adjusted: OR = 0.28 (0.14–0.87) | IG - Active phase: 7.8 ± 5.2 h CG - Active phase: 7.7 ± 5.4 h Adjusted: OR = 0.83 (0.71–1.16) | IG - C-sec: 14.3% CG - C-sec: 14.3% Adjusted: OR = 1.09 (0.84 - 1.41) |
| Rodríguez-Blanque et al (2019) [42] | IG: Exercise CG: Standard | Required induction: IG: 21.5% CG: 29.7% P > 0.05 | IG - stage 1 median: 260.00 min IG - stage 2 median: 90.00 min CG - stage 1 median: 405.00 min CG - stage 2 median: 152.50 min P (stage 1) < 0.001 P (stage 2) = 0.007 | IG - NSVD: 63.07% IG - C-sec: 12.30% CG - NSVD: 56.25% CG - C-sec: 14.06% P (NSVD) > 0.05 P (C-sec) > 0.05 |
| Rong et al (2021) [43] | IG: Yoga CG: Standard | - | IG - stage 1: 469.57 ± 158.04 min IG - stage 2: 33.26 ± 13.74 min CG - stage 1: 578.47 ± 123.79 min CG - stage 2: 43.41 ± 11.59 min P (stage 1) = 0.012 P (stage 2) = 0.001 | IG - NSVD: 87.5% IG - C-sec 12.5% CG - NSVD: 65.6% CG - C-sec: 34.4% P (ALL) = 0.039 |
| Shojaei et al (2021) [44] | IG: Walking CG: Standard | Required induction: IG: 20.4% CG: 47.1% P = 0.005 | IG - stage 1: 422.91 ± 370.11 min IG - stage 2: 33.30 ± 34.47 min CG - stage 1: 612.45 ± 680.58 min CG - stage 2: 45.96 ± 47.50 min P (stage 1) = 0.132 P (stage 2) = 0.242 | IG - NSVD: 83.7% IG - C-sec: 10.2% CG - NSVD: 43.1% CG - C-sec: 49.0% P (ALL) < 0.001 |
| Study | Spontaneous labor | Timing | Delivery method |
|---|---|---|---|
| Spontaneous labor: percent of patients with spontaneous labor; Timing: duration from intervention to labor onset, measured as percent delivered within 24 h or percent delivered within 72 h; IG: intervention group; CG: control group; NSVD: normal spontaneous vaginal delivery; C-sec: cesarean section. | |||
| Ali et al (2021) [45] | IG: 88.33% CG: None | - | - |
| Butt et al (2021) [46] | IG: 50.6% CG: 33.3% P = 0.051 | - | IG - NSVD: 22.6% CG - NSVD: 28% P (NSVD) = 0.075 |
| Hassan (2023) [47] | IG - 1 sweep: 38.8% IG - 2 sweeps: 47.6% CG: None | Within 24 h: IG: 41.5% | IG - NSVD: 86.4% IG - C-sec: 10.9% |
| Ugwu et al (2014) [48] | IG: 56.5% CG: 31.1% P = 0.007 | Within 72 h: IG: 48.4% CG: 23.0% P = 0.006 | IG - NSVD: 84.6% CG - NSVD: 73% P (NSVD) = 0.19 |
| Study | Route | Bishop score | Labor initiation | Labor duration | Timing | C-section rate |
|---|---|---|---|---|---|---|
| Labor initiation: percent requiring induction of labor; Timing: duration from intervention to labor onset; PV: per vagina primrose oil; PO: per oral primrose oil; IG: intervention group; CG: control group. | ||||||
| Ariana et al (2024) [49] | PV | IG: 5.83 ± 1.68 CG: 5.19 ± 1.52 P = 0.002 | IG: 10.4% CG: 31.3% P = 0.012 | IG - latent phase: 14.7 ± 4.05 h IG - active phase: 2.47 ± 1.41 h CG - latent phase: 17.37 ± 4.05 h CG - active phase: 3.65 ± 1.62 h P (latent) = 0.001 P (active) < 0.001 | - | - |
| Azad et al (2022) [50] | PV | IG: 6.96 ± 0.18 CG: 3.67 ± 0.25 P = 0.01 | - | IG - latent phase: 7.31 ± 2.13 h IG - active phase: 3.67 ± 1.08 h IG - second stage: 68.31 ± 12.13 h CG - latent phase: 9.81 ± 1.08 h CG - active phase: 3.42 ± 1.16 h CG - second stage: 70.31 ± 11.03 h P (latent) = 0.031 P (active) = 0.244 P (stage 2) = 0.531 | - | IG: 26.13% CG: 29.88% P = 0.149 |
| Diansuy & Aguilar (2017) [51] | PV | Percent changed after 4 h: IG: 85% P = 0.001 | - | - | - | - |
| Hashemnejad et al (2019) [52] | PV | - | - | IG - active phase: 60.68 h CG - active phase: 73.83 h P (active) = 0.150 | IG: 13.4 h CG: 19.06 h P = 0.168 | - |
| Heydari et al (2022) [53] | PO, PV | IG - PO: 6.85 ± 1.62 IG - PV: 7.86 ± 1.24 CG: 5.62 ± 1.62 P (ALL) = 0.001 P (PO vs. PV) > 0.05 | IG - PO: 72.5% IG - PV: 55.8% CG: 68.29% P (ALL) = 0.26 | IG - PO stage 2: 48.71 ± 28.96 h IG - PV stage 2: 40.83 ± 20.06 h CG - stage 2: 56.18 ± 21.78 h P (ALL, stage 2) = 0.033 | - | IG PO: 12.2% IG PV: 18.6% CG: 26.2% P (ALL) = 0.267 |
| Jahdi et al (2016) [54] | PO | IG: 3.60 ± 1.75 CG: 4.35 ± 2.34 P = 0.11 | - | - | - | - |
| Poor et al (2023) [55] | PO, PV | After 2 h: IG - PO: 5.47 ± 1.67 IG - PV: 6.28 ± 1.91 CG: 4.09 ± 1.61 P (PO vs. CG) < 0.001 P (PV vs. CG) < 0.001 P (PO vs. PV) = 0.067 | - | IG - PO phase 1: 255 min IG - PO phase 2: 15 min IG - PV phase 1: 190 min IG - PV phase 2: 10 min CG - phase 1: 450 min CG - phase 2: 30 min P (ALL, phase 1) < 0.001 P (ALL, phase 2) < 0.001 | IG PO: 300 min IG PV: 210 min CG: 487.50 min P (ALL) < 0.001 | IG PO: 19.3% IG PV: 10.7% CG: 12.3% P (ALL) = 0.373 |
| Shahraki et al (2023) [56] | PV | IG: 9.05 ± 0.91 CG: 8.67 ± 0.094 P = 0.03 | IG: 74.5% CG: 87.3% P = 0.09 | - | IG: 19.85 ± 2.47 h CG: 20.57 ± 1.91 h P = 0.09 | IG: 45.5% CG: 65.5% P = 0.03 |
| Study | Labor initiation | Timing | Gestational age | C-section rate |
|---|---|---|---|---|
| Labor initiation: rate of spontaneous labor or rate of requiring induction; Timing: duration from intervention/counseling to delivery; Gestational age: gestational age of the baby at the time of delivery; IG: intervention group; CG: control group. | ||||
| Atrian et al (2015) [57] | - | - | IG: 268 ± 10 days CG: 273 ± 8 days P = 0.005 | P = 0.820 |
| Foumane et al (2014) [58] | Spontaneous labor: IG: 94.4% CG: 88.9% P = 0.18 Required induction: IG: 5.6% CG: 11.1% P = 0.18 | - | Before 41 weeks: IG: 90.3% CG: 81.9% P = 0.22 | IG: 6.9% CG: 20.8% P < 0.02 |
| Omar et al (2013) [59] | Spontaneous labor: IG: 87.6% CG: 86.3% P = 0.278 Required induction: IG: 22.0% CG: 20.8% P = 0.666 | IG: 3.2 ±1.4 days CG: 3.3 ± 1.3 days P = 0.417 | IG: 39.4 ± 1.2 weeks CG: 39.5 ± 1.2 weeks P = 0.112 | IG: 8% CG: 17.6% P > 0.05 |
| Schaffir (2006) [60] | Required induction: IG: 25.5% CG: 10.9% P = 0.106 | IG: 2.3 ± 1.1 weeks CG: 1.5 ± 0.9 weeks P < 0.001 | IG: 39.9 ± 0.9 weeks CG: 39.3 ± 0.9 weeks P = 0.001 | IG: 17% CG: 4.4% P = 0.091 |
| Tan et al (2006) [61] | Required induction: IG - frequent: 9.8% IG - infrequent: 1.3% CG: 23.8% P (IG infrequent vs. CG) = 0.41 P (IG frequent vs. CG) = 0.06 | > 41 weeks: IG - frequent: 4% IG - infrequent: 12.2% CG: 29.8% P (IG infrequent vs. CG) = 0.41 P (IG frequent vs. CG) = 0.06 | IG - frequent: 39.1 ± 1.1 weeks IG - infrequent: 39.7 ± 1.0 weeks CG: 39.9 ± 1.2 weeks P (ALL) < 0.001 | - |
| Tan et al (2007) [62] | Spontaneous labor: IG: 55.6% CG: 52% P = 0.68 | IG: 4.3 ± 3.2 days CG: 5.2 ± 3.6 days P = 0.65 | - | IG: 25% CG: 20.6% P = 0.75 |
| Tan et al (2009) [63] | Spontaneous labor: IG (2+/week): 36.8% IG (1/week): 58.3% CG: 60.6% P (ALL) = 0.012 P (trend) = 0.006 | IG: 5.7 ± 3.8 days CG: 3.8 ± 2.6 days P < 0.001 | - | IG: 24.8% CG: 69.5% P = 0.73 |