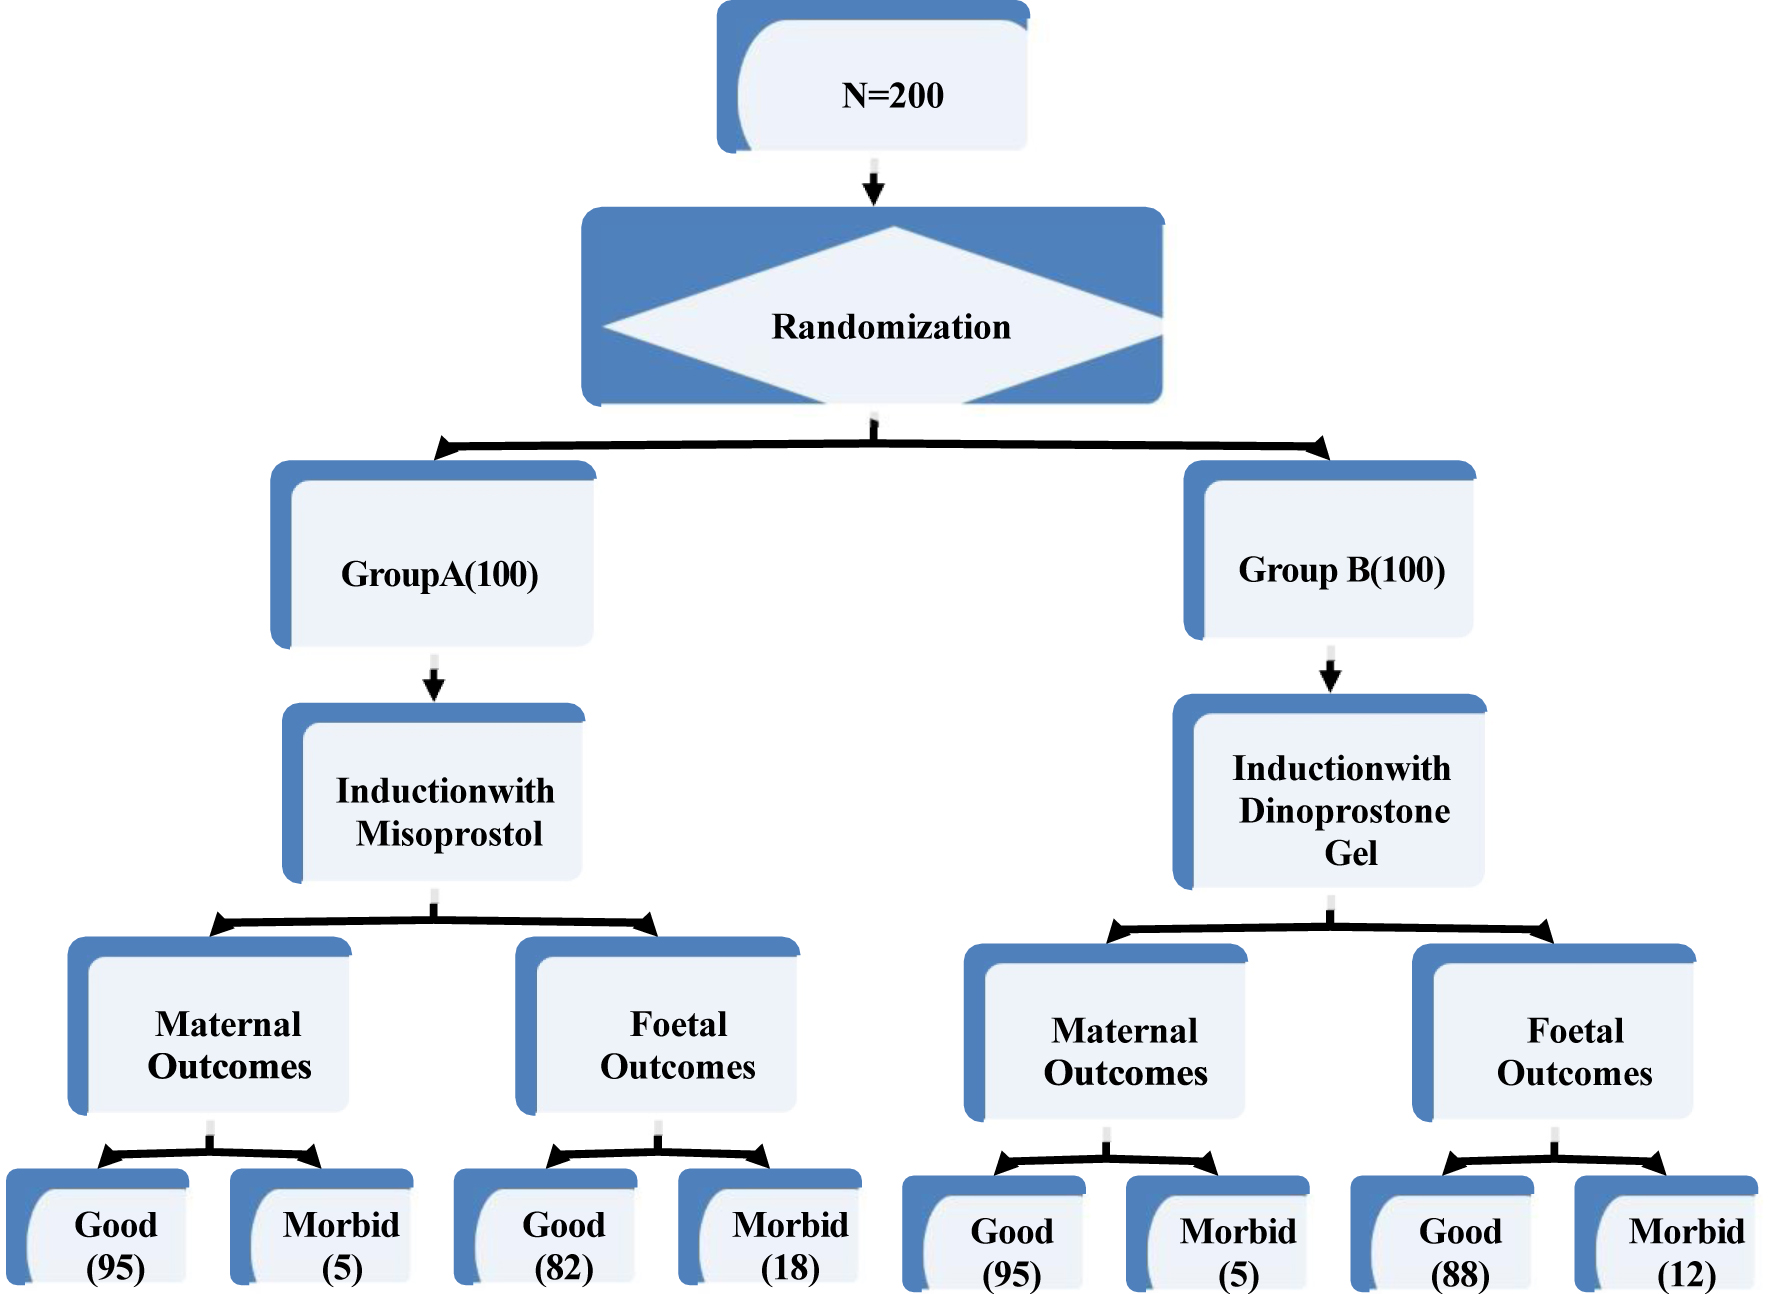
↓ Figure 1. Flow chart of steps used in
prospective interventional study with the maternal and fetal outcomes.
| Journal of Clinical Gynecology and Obstetrics, ISSN 1927-1271 print, 1927-128X online, Open Access |
| Article copyright, the authors; Journal compilation copyright, J Clin Gynecol Obstet and Elmer Press Inc |
| Journal website https://jcgo.elmerpub.com |
Original Article
Volume 14, Number 4, December 2025, pages 167-175
Comparative Analysis of Intracervical Dinoprostone Gel and Vaginal Misoprostol for Labor Induction in a Primigravida at Term
Figure
Tables
| Variables | Groups | Number | Mean | Standard deviation | P-value |
|---|---|---|---|---|---|
| Age (years) | Intravaginal misoprostol | 100 | 23.98 | 3.86 | > 0.46 |
| Dinoprostone gel | 100 | 23.62 | 3.01 | ||
| Period of gestation (weeks) | Intravaginal misoprostol | 100 | 38.73 | 1.09 | > 0.89 |
| Dinoprostone gel | 100 | 38.75 | 0.97 | ||
| Bishop score | Intravaginal misoprostol | 100 | 4.69 | 0.95 | > 0.17 |
| Dinoprostone gel | 100 | 4.08 | 1.01 | ||
| Duration of labor (h) | Intravaginal misoprostol | 100 | 12.38 | 4.55 | > 0.10 |
| Dinoprostone gel | 100 | 15.49 | 3.72 |
| Mode of induction | Change in Bishop score | Total | Statistical test | |
|---|---|---|---|---|
| Yes | No | |||
| Intravaginal misoprostol | 99 (99.0%) | 1 (1.0%) | 100 (100.0%) | χ2 = 6.37 df = 1 P-valve < 0.01 |
| Dinoprostone gel | 91 (91.0%) | 9 (9.0%) | 100 (100.0%) | |
| Total | 190 (95.0%) | 10 (5.0%) | 200 (100.0%) | |
| Mode of induction | Induction to active phase of labor | Total | Statistical test | |
|---|---|---|---|---|
| Yes | No | |||
| Intravaginal misoprostol | 75 (75.0%) | 25 (25.0%) | 100 (100.0%) | χ2 = 0.89 df = 1 P-valve = 0.43 |
| Dinoprostone gel | 69 (69.0%) | 31 (31.0%) | 100 (100.0%) | |
| Total | 144 (72.0%) | 56 (28.0%) | 200 (100.0%) | |
| Variables | Mode of induction | N | Mean (h) | Standard deviation (h) | t-test |
|---|---|---|---|---|---|
| Total duration if induction (years) | Dinoprostone gel | 100 | 15.49 | 3.72 | P-value < 0.05 |
| Intravaginal misoprostol | 100 | 12.38 | 4.55 | ||
| Induction to active phase of labor (h) | Dinoprostone gel | 69 | 8.30 | 3.82 | P-value < 0.05 |
| Intravaginal misoprostol | 74 | 6.16 | 3.31 | ||
| Induction to delivery interval (h) | Dinoprostone gel | 100 | 14.06 | 3.66 | P-value < 0.05 |
| Intravaginal misoprostol | 100 | 10.84 | 4.40 | ||
| Apgar score at 1 min | Dinoprostone gel | 100 | 9.70 | 0.71 | P-value < 0.23 |
| Intravaginal misoprostol | 100 | 9.55 | 1.02 | ||
| Apgar score at 5 min | Dinoprostone gel | 100 | 9.98 | 0.20 | P-value < 0.90 |
| Intravaginal misoprostol | 100 | 9.86 | 0.51 |
| Mode of induction | Induction to delivery interval groups (h) | Total | Statistical test | ||
|---|---|---|---|---|---|
| 4 - 10 | 10 - 16 | 16 - 22 | |||
| Intravaginal misoprostol | 61 (61.0%) | 33 (33.0%) | 6 (6%) | 100 (100.0%) | χ2 = 8.89 df = 2 P-value < 0.01 |
| Dinoprostone gel | 40 (40.0%) | 52 (52.0%) | 8 (8%) | 100 (100.0%) | |
| Total | 101 (50.5%) | 85 (42.5%) | 14 (7%) | 200 (100.0%) | |
| Mode of induction | Need for oxytocin augmentation | Total | Statistical test | |
|---|---|---|---|---|
| Yes | No | |||
| Intravaginal misoprostol | 67 (67.0%) | 33 (33.0%) | 100 (100.0%) | χ2 = 25.47 df = 1 P-value < 0.001 |
| Dinoprostone gel | 95 (95.0%) | 5 (5.0%) | 100 (100.0%) | |
| Total | 140 (72.0%) | 60 (28.0%) | 200 (100.0%) | |
| Mode of induction | Mode of delivery | Total | Statistical test | |
|---|---|---|---|---|
| FTND | LSCS | |||
| FTND: full-term normal delivery; LSCS: lower segment cesarean section. | ||||
| Intravaginal misoprostol | 71 (71.0%) | 29 (25.0%) | 100 (100.0%) | χ2 = 0.95 df = 1 P-value = 0.87 |
| Dinoprostone gel | 69 (69.0%) | 31 (31.0%) | 100 (100.0%) | |
| Total | 140 (72.0%) | 60 (28.0%) | 200 (100.0%) | |
| Mode of induction | Intrapartum complications (tachysystole) | Total | Statistical test | |
|---|---|---|---|---|
| Absent | Present | |||
| Intravaginal misoprostol | 98 (98.0%) | 2 (2.0%) | 100 (100.0%) | Fisher’s exact test P-value = 0.49 |
| Dinoprostone gel | 100 (95.0%) | 0 (5.0%) | 100 (100.0%) | |
| Total | 198 (99.0%) | 2 (1.0%) | 200 (100.0%) | |
| Mode of induction | Postpartum complications | Total | Statistical test | |
|---|---|---|---|---|
| Absent | Present | |||
| Intravaginal misoprostol | 95 (95.0%) | 5 (5.0%) | 100 (100.0%) | χ2 = 0 df = 1 P-value = 1 |
| Dinoprostone gel | 95 (95.0%) | 5 (5.0%) | 100 (100.0%) | |
| Total | 190 (95.0%) | 10 (5.0%) | 200 (100.0%) | |
| Mode of induction | Fetal outcomes at birth | Total | Statistical test | |
|---|---|---|---|---|
| Good | Morbid | |||
| Intravaginal misoprostol | 82 (82.0%) | 18 (18.0%) | 100 (100.0%) | χ2 = 1.41 df = 1 P-value = 0.32 |
| Dinoprostone gel | 88 (88.0%) | 12 (12.0%) | 100 (100.0%) | |
| Total | 170 (85.0%) | 30 (15.0%) | 200 (100.0%) | |