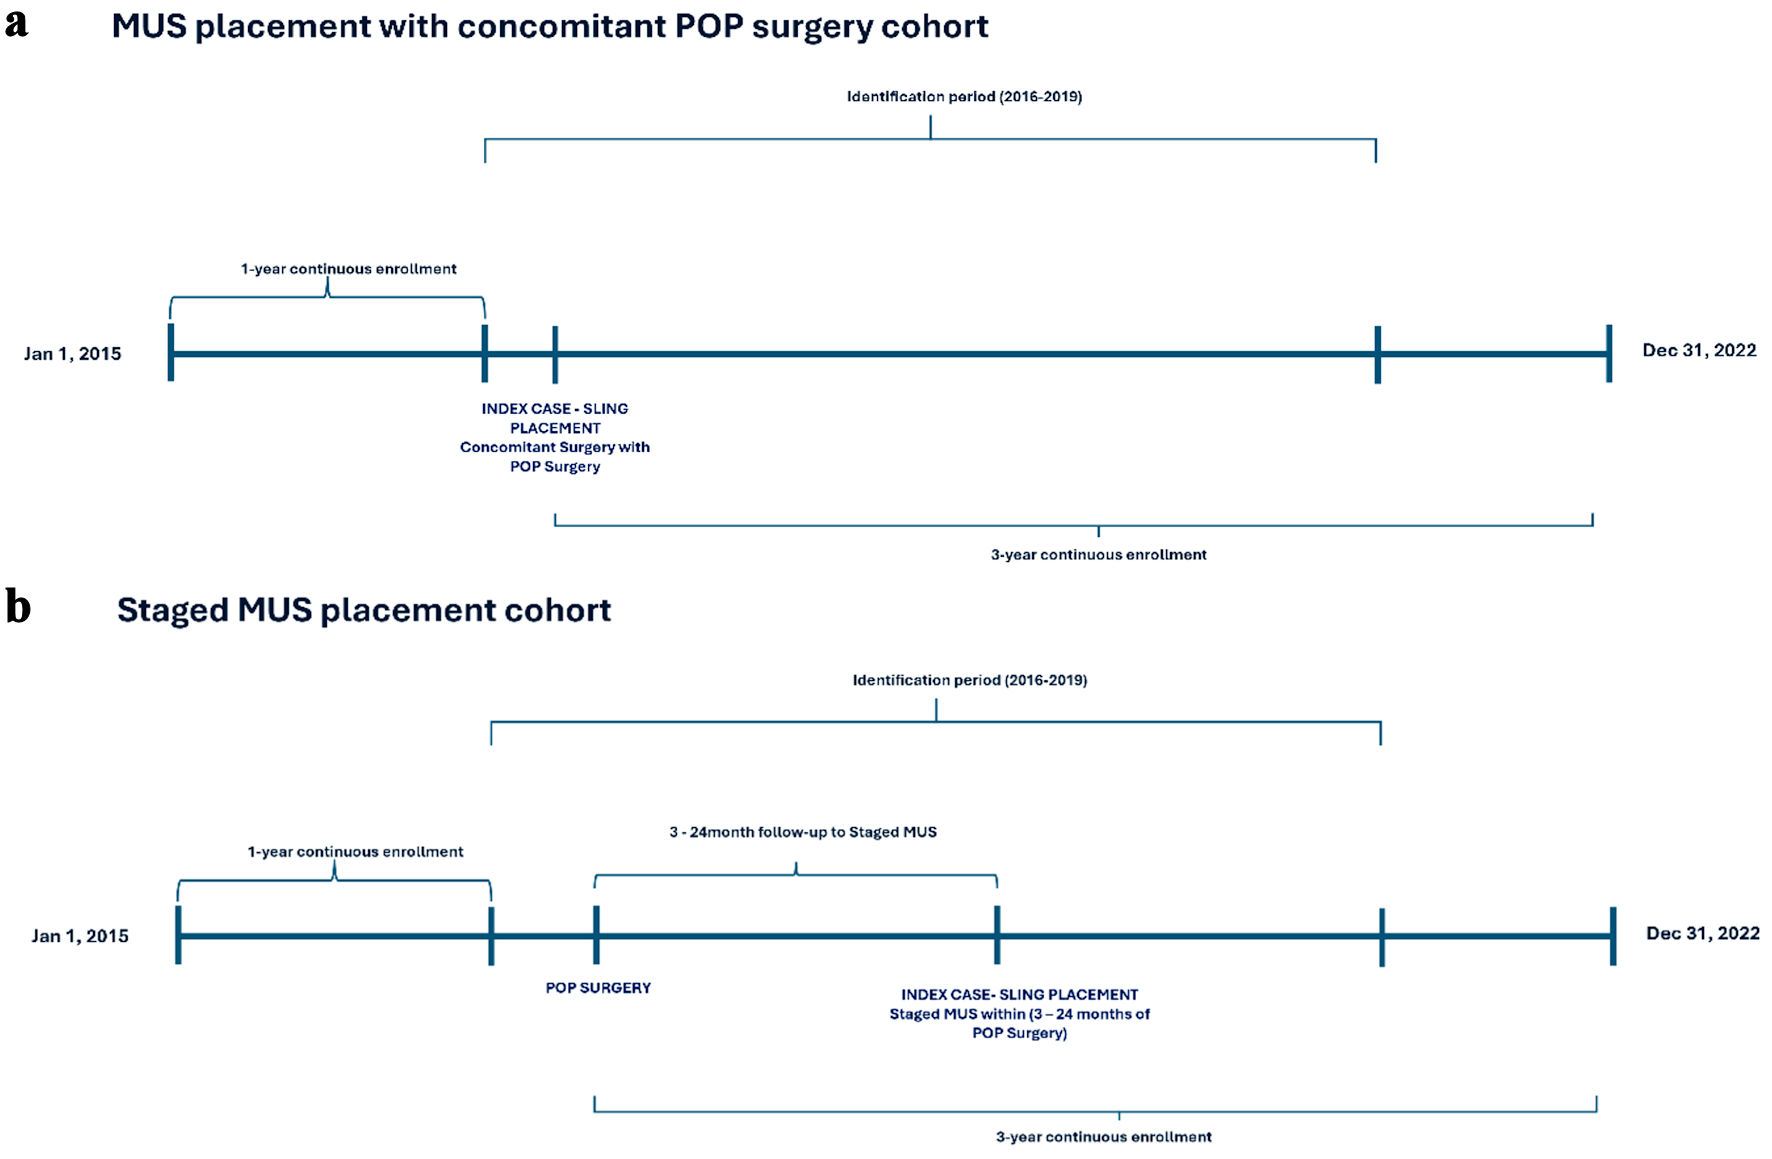
↓ Figure 1. Study design and cohort selection.
MUS: mid-urethral sling; POP: pelvic organ prolapse.
| Journal of Clinical Gynecology and Obstetrics, ISSN 1927-1271 print, 1927-128X online, Open Access |
| Article copyright, the authors; Journal compilation copyright, J Clin Gynecol Obstet and Elmer Press Inc |
| Journal website https://jcgo.elmerpub.com |
Original Article
Volume 14, Number 3, October 2025, pages 75-83
Socioeconomic, Demographic, and Provider Determinants of Staged Versus Concomitant Surgery for Pelvic Organ Prolapse and Stress Urinary Incontinence
Figure
Tables
| Concomitant (n = 39,440) | Staged (n = 1,402) | P value | |
|---|---|---|---|
| *Statistical significance at P < 0.05. aOther specialty include general surgery, unknown physician specialty, and others. CCI: Charlson Comorbidity Index; MUS: mid-urethral sling; POP: pelvic organ prolapse. | |||
| Age category | |||
| < 70 | 36.2% | 33.2% | 0.022* |
| 70 - 74 | 31.0% | 34.0% | |
| 75 - 79 | 20.6% | 21.7% | |
| ≥ 80 | 12.3% | 11.1% | |
| Race | |||
| American Indian or Alaskan Native | 0.5% | 0.4% | 0.003* |
| Asian | 1.0% | 0.4% | |
| Black | 2.9% | 2.1% | |
| Caucasian | 91.6% | 94.4% | |
| Hispanic | 1.8% | 0.9% | |
| Other | 1.2% | 0.6% | |
| Unknown | 1.2% | 1.2% | |
| Region | |||
| Midwest | 22.8% | 23.0% | < 0.001* |
| Northeast | 16.6% | 12.1% | |
| South | 39.9% | 46.0% | |
| West | 20.6% | 18.9% | |
| Urban or rural | |||
| Rural | 8.1% | 7.5% | 0.389 |
| Urban | 91.9% | 92.5% | |
| CCI | |||
| 0 | 39.0% | 36.7% | 0.348 |
| 1 - 3 | 43.3% | 45.2% | |
| 4 - 6 | 13.0% | 13.3% | |
| ≥ 7 | 4.6% | 4.9% | |
| Specialty (POP) | |||
| Urology | 15.7% | 13.7% | 0.024* |
| Obstetrics/gynecology | 80.1% | 81.0% | |
| Other | 4.2% | 5.3% | |
| Specialty (MUS) | |||
| Urology | 15.7% | 19.7% | < 0.001* |
| Obstetrics/gynecology | 80.1% | 75.5% | |
| Othera | 4.2% | 4.8% | |
| Total | Concomitant | Staged | P value |
|---|---|---|---|
| (N = 39,440) | (N = 1,402) | ||
| *P < 0.05. AHRQ: Agency for Healthcare Research and Quality; MUS: mid-urethral sling; POP: pelvic organ prolapse; SDOH: Social Determinants of Health. | |||
| % Foreign-born | 11.6% | 10.2% | < 0.001* |
| % Limited English-speaking | 3.6% | 3.1% | < 0.001* |
| Gini | 0.457 | 0.454 | 0.007* |
| Median household income | $64,298 | $61,906 | < 0.001* |
| Per capita income ($) | $33,448 | $32,296 | < 0.001* |
| % With any postsecondary education (age ≥ 25) | 60.30% | 59.50% | 0.003* |
| % Uninsured | 8.70% | 8.9% | 0.098 |
| % Uninsured < 64 | 10.30% | 10.6% | 0.038* |
| Number of non-federal obstetric gynecologists per 1,000 population | 0.107 | 0.103 | 0.058 |
| Median distance to nearest obstetrics department (miles) | 5.13 | 5.22 | 0.488 |
| Mean distance to nearest obstetrics department (miles) | 5.86 | 6.00 | 0.258 |
| Staged (vs. concomitant) | |||||||
|---|---|---|---|---|---|---|---|
| -1 | -2 | -3 | -4 | -5 | -6 | -7 | |
| **Significant at 0.05. ***Significant at 0.01. CCI: Charlson Comorbidity Index; MUS: mid-urethral sling; OBGYN: obstetrics and gynecology; POP: pelvic organ prolapse. | |||||||
| Race (reference Caucasian) | |||||||
| American Indian or Alaskan Native | 0.989 | 0.924 | 0.97 | 0.975 | 0.943 | 0.967 | 0.985 |
| (0.437, 2.242) | (0.407, 2.095) | (0.427, 2.201) | (0.429, 2.214) | (0.415, 2.145) | (0.426, 2.196) | (0.433, 2.236) | |
| Asian | 0.363** | 0.393** | 0.393** | 0.388** | 0.418 | 0.411** | 0.387** |
| (0.150, 0.880) | (0.162, 0.954) | (0.162, 0.953) | (0.160, 0.942) | (0.172, 1.015) | (0.169, 0.997) | (0.159, 0.939) | |
| Black | 0.681** | 0.682** | 0.678** | 0.669** | 0.680** | 0.676** | 0.668** |
| (0.469, 0.990) | (0.469, 0.991) | (0.467, 0.986) | (0.460, 0.973) | (0.468, 0.990) | (0.465, 0.983) | (0.459, 0.972) | |
| Hispanic | 0.487** | 0.491** | 0.502** | 0.497** | 0.554** | 0.561 | 0.493** |
| (0.274, 0.865) | (0.276, 0.873) | (0.282, 0.893) | (0.279, 0.884) | (0.310, 0.990) | (0.314, 1.004) | (0.277, 0.877) | |
| Other | 0.52 | 0.542 | 0.545 | 0.54 | 0.572 | 0.568 | 0.538 |
| (0.258, 1.050) | (0.268, 1.094) | (0.270, 1.100) | (0.267, 1.091) | (0.283, 1.157) | (0.281, 1.149) | (0.266, 1.087) | |
| Unknown | 1.06 | 1.105 | 1.105 | 1.099 | 1.119 | 1.114 | 1.097 |
| (0.651, 1.727) | (0.678, 1.800) | (0.678, 1.802) | (0.674, 1.792) | (0.686, 1.824) | (0.683, 1.816) | (0.673, 1.789) | |
| Region (reference South) | |||||||
| Midwest | 0.878 | 0.888 | 0.820** | 0.821** | 0.818** | 0.836** | 0.815** |
| (0.765, 1.008) | (0.773, 1.021) | (0.700, 0.960) | (0.701, 0.962) | (0.697, 0.959) | (0.712, 0.981) | (0.694, 0.956) | |
| Northeast | 0.629*** | 0.724*** | 0.657*** | 0.652*** | 0.673*** | 0.695*** | 0.645*** |
| (0.529, 0.748) | (0.600, 0.874) | (0.534, 0.810) | (0.529, 0.803) | (0.544, 0.832) | (0.560, 0.862) | (0.522, 0.796) | |
| West | 0.813*** | 0.812*** | 0.773*** | 0.782*** | 0.855 | 0.85 | 0.776*** |
| (0.701, 0.943) | (0.696, 0.947) | (0.659, 0.909) | (0.665, 0.920) | (0.718, 1.018) | (0.715, 1.010) | (0.659, 0.914) | |
| Urban (reference rural) | 1.153 | 1.238** | 1.237** | 1.234 | 1.280** | 1.286** | 1.23 |
| (0.938, 1.416) | (1.003, 1.529) | (1.002, 1.527) | (0.999, 1.523) | (1.035, 1.582) | (1.040, 1.591) | (0.996, 1.519) | |
| Specialty POP | |||||||
| Urology | 0.840** | 0.833** | 0.838** | 0.839** | 0.838** | 0.838** | 0.838** |
| (0.717, 0.985) | (0.710, 0.976) | (0.715, 0.983) | (0.716, 0.984) | (0.715, 0.983) | (0.715, 0.982) | (0.715, 0.982) | |
| Obstetrics/gynecology | 1 | 1 | 1 | 1 | 1 | 1 | 1 |
| (1.000, 1.000) | (1.000, 1.000) | (1.000, 1.000) | (1.000, 1.000) | (1.000, 1.000) | (1.000, 1.000) | (1.000, 1.000) | |
| Other | 1.245 | 1.25 | 1.254 | 1.259 | 1.275 | 1.275 | 1.258 |
| (0.974, 1.591) | (0.977, 1.598) | (0.981, 1.604) | (0.985, 1.610) | (0.997, 1.631) | (0.997, 1.631) | (0.984, 1.609) | |
| Per capita income (in $1,000) | 0.981*** | 0.979*** | 0.979*** | 0.988 | 0.984** | 0.979*** | |
| (0.969, 0.993) | (0.967, 0.991) | (0.967, 0.991) | (0.975, 1.002) | (0.971, 0.997) | (0.967, 0.991) | ||
| % Households with post-secondary education (age ≥ 25) | 1.005 | 1.004 | 1.002 | 0.999 | 0.998 | 1.002 | |
| (0.996, 1.015) | (0.995, 1.014) | (0.993, 1.012) | (0.989, 1.009) | (0.988, 1.009) | (0.992, 1.012) | ||
| % Households with < 64 years uninsured | 0.985** | 0.984** | 0.994 | 0.995 | 0.984** | ||
| (0.971, 0.999) | (0.970, 0.999) | (0.978, 1.009) | (0.979, 1.011) | (0.970, 0.999) | |||
| OBGYN density | 1.651 | 1.802 | 1.873 | 1.445 | |||
| (0.669, 4.074) | (0.683, 4.758) | (0.707, 4.963) | (0.548, 3.813) | ||||
| Median distance to nearest obstetrics department | 0.99 | 0.99 | 0.995 | ||||
| (0.977, 1.004) | (0.977, 1.004) | (0.982, 1.008) | |||||
| % Households foreign-born | 0.986*** | ||||||
| (0.978, 0.995) | |||||||
| % Households limited English-speaking | 0.969*** | ||||||
| (0.949, 0.989) | |||||||
| _cons | 0.038*** | 0.048*** | 0.065*** | 0.071*** | 0.065*** | 0.073*** | 0.077*** |
| (0.031, 0.046) | (0.033, 0.069) | (0.041, 0.105) | (0.043, 0.116) | (0.038, 0.112) | (0.043, 0.125) | (0.045, 0.130) | |
| N | 39,991 | 39,921 | 399,21 | 39,921 | 39,921 | 39,921 | 39,921 |