Figures
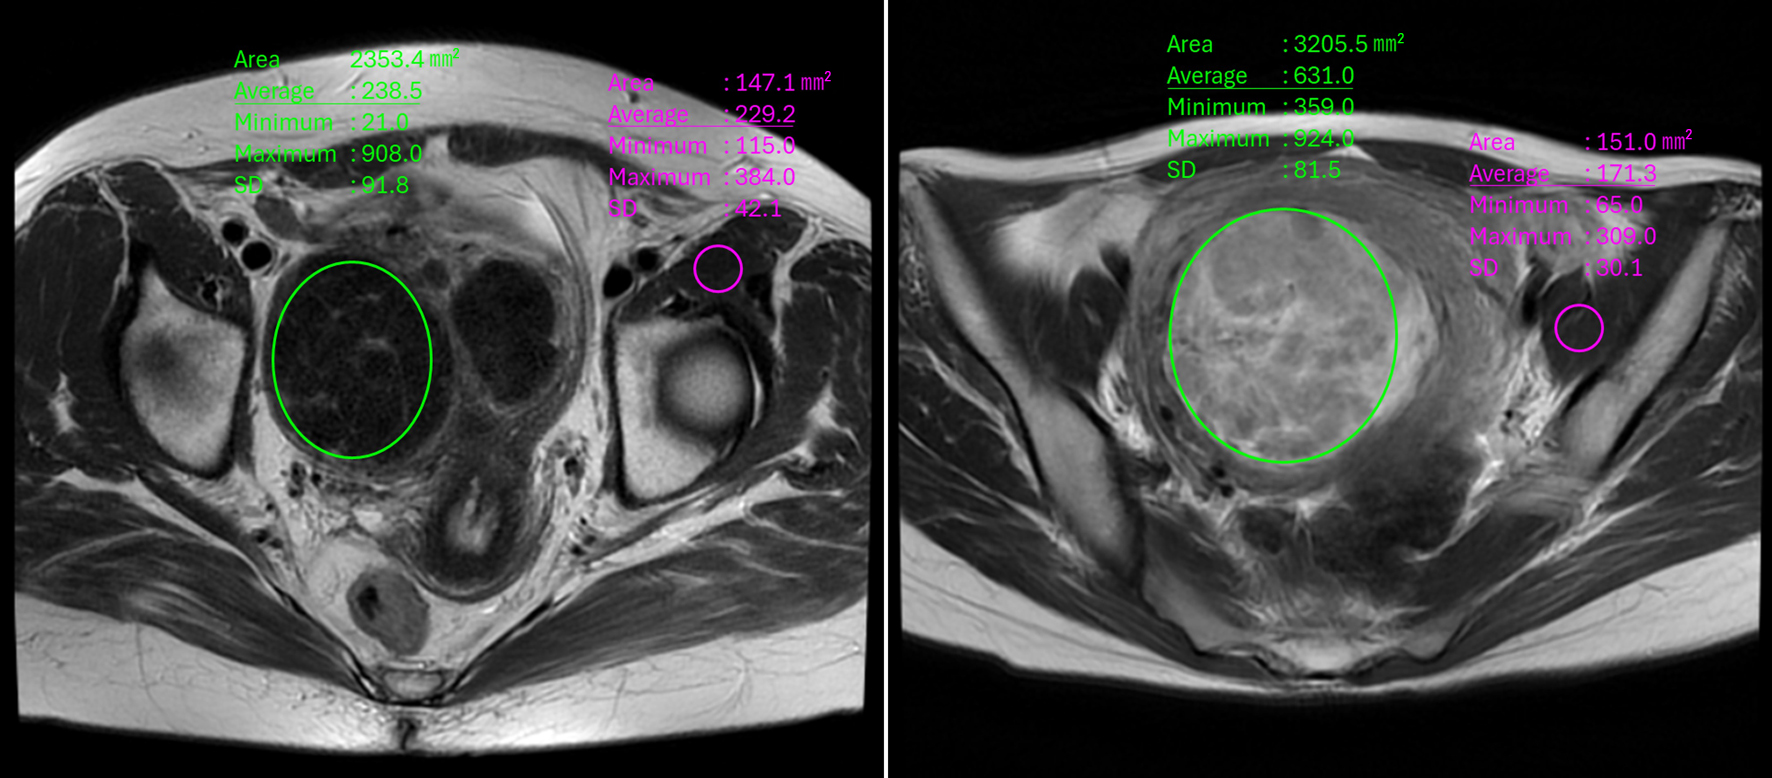
Figure 1. Region of interest (ROI) setting in T2-weighted images. In the T2-weighted image of this case, the ROI of the uterine fibroid was set in the area surrounded by the green line. We selected a site that contained as large an ellipse as possible without including cystic or necrotic areas with high signal intensity. The ROI was set for the iliac muscle in the same way (the area surrounded by the purple line).
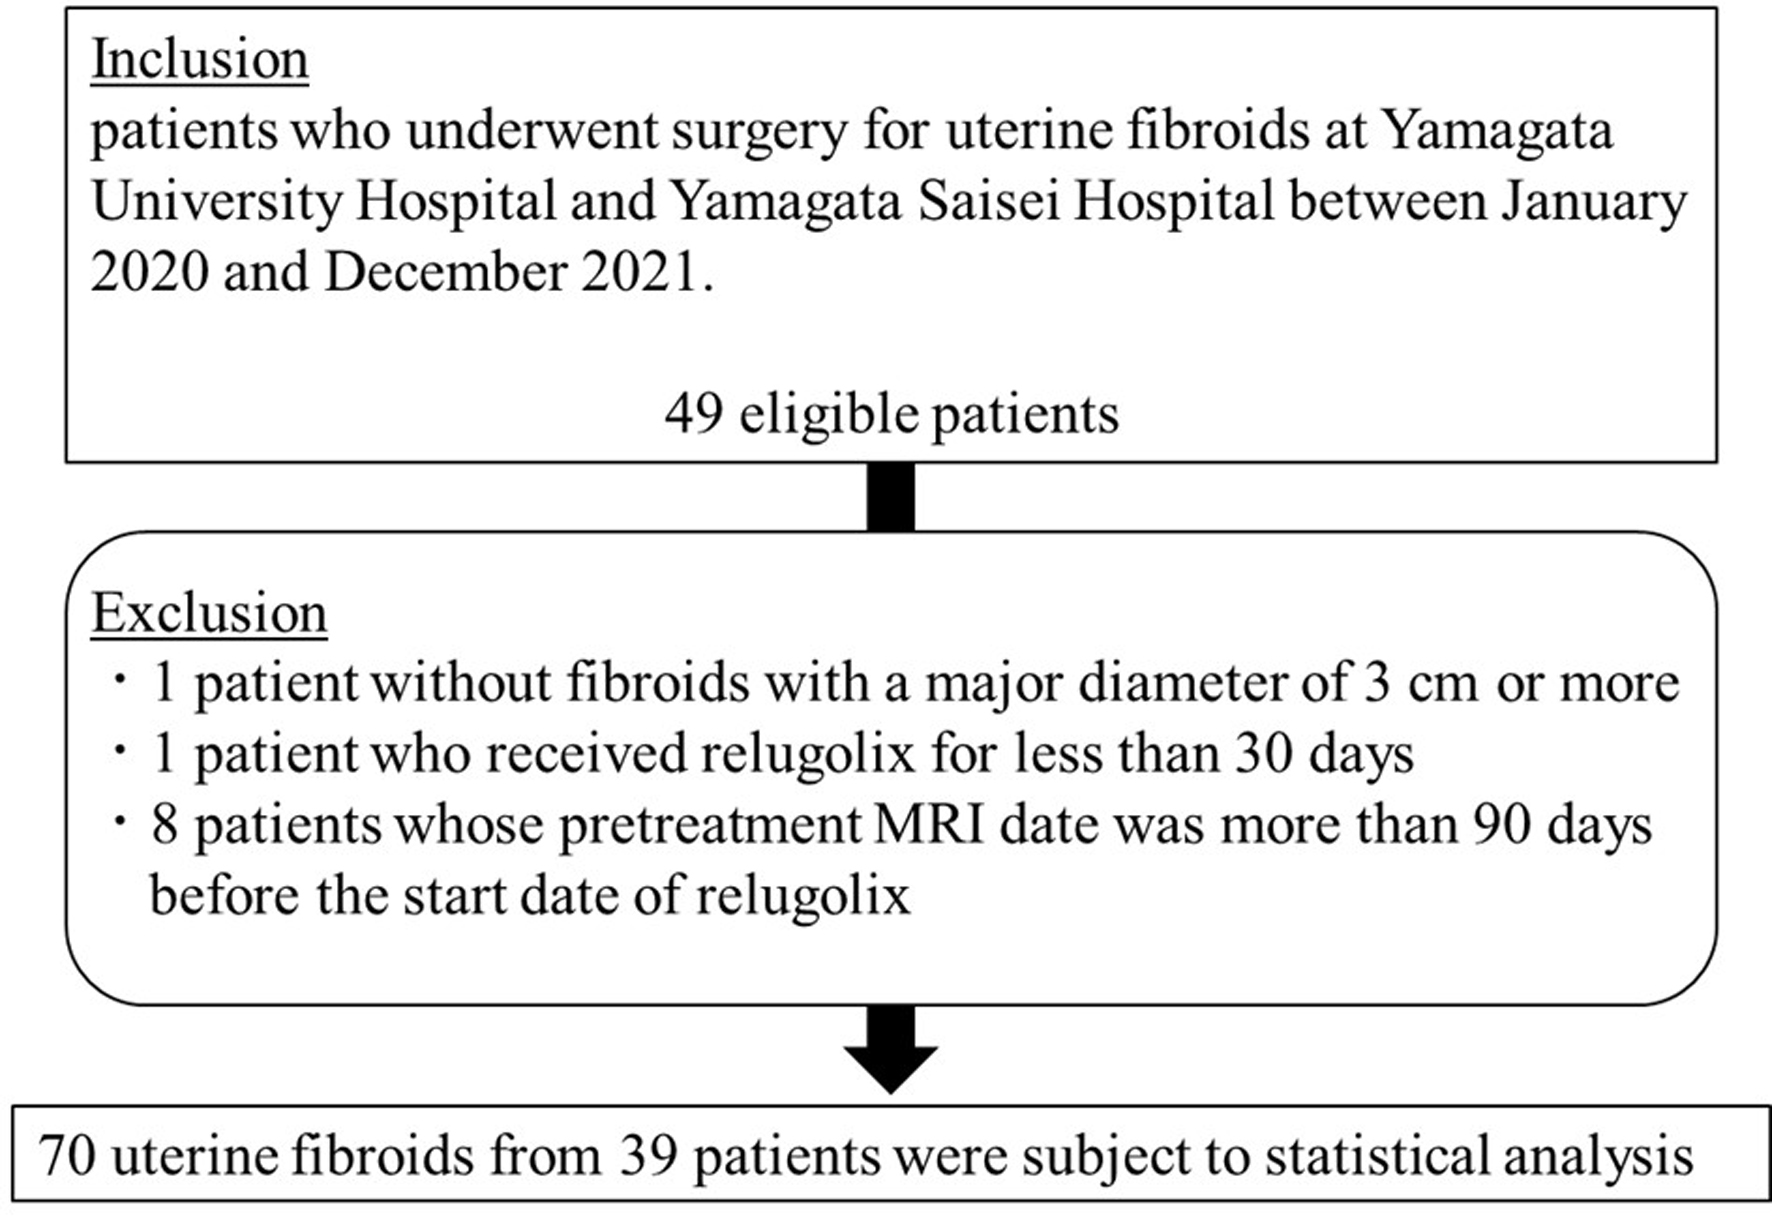
Figure 2. Patients and uterine fibroids selection criteria.
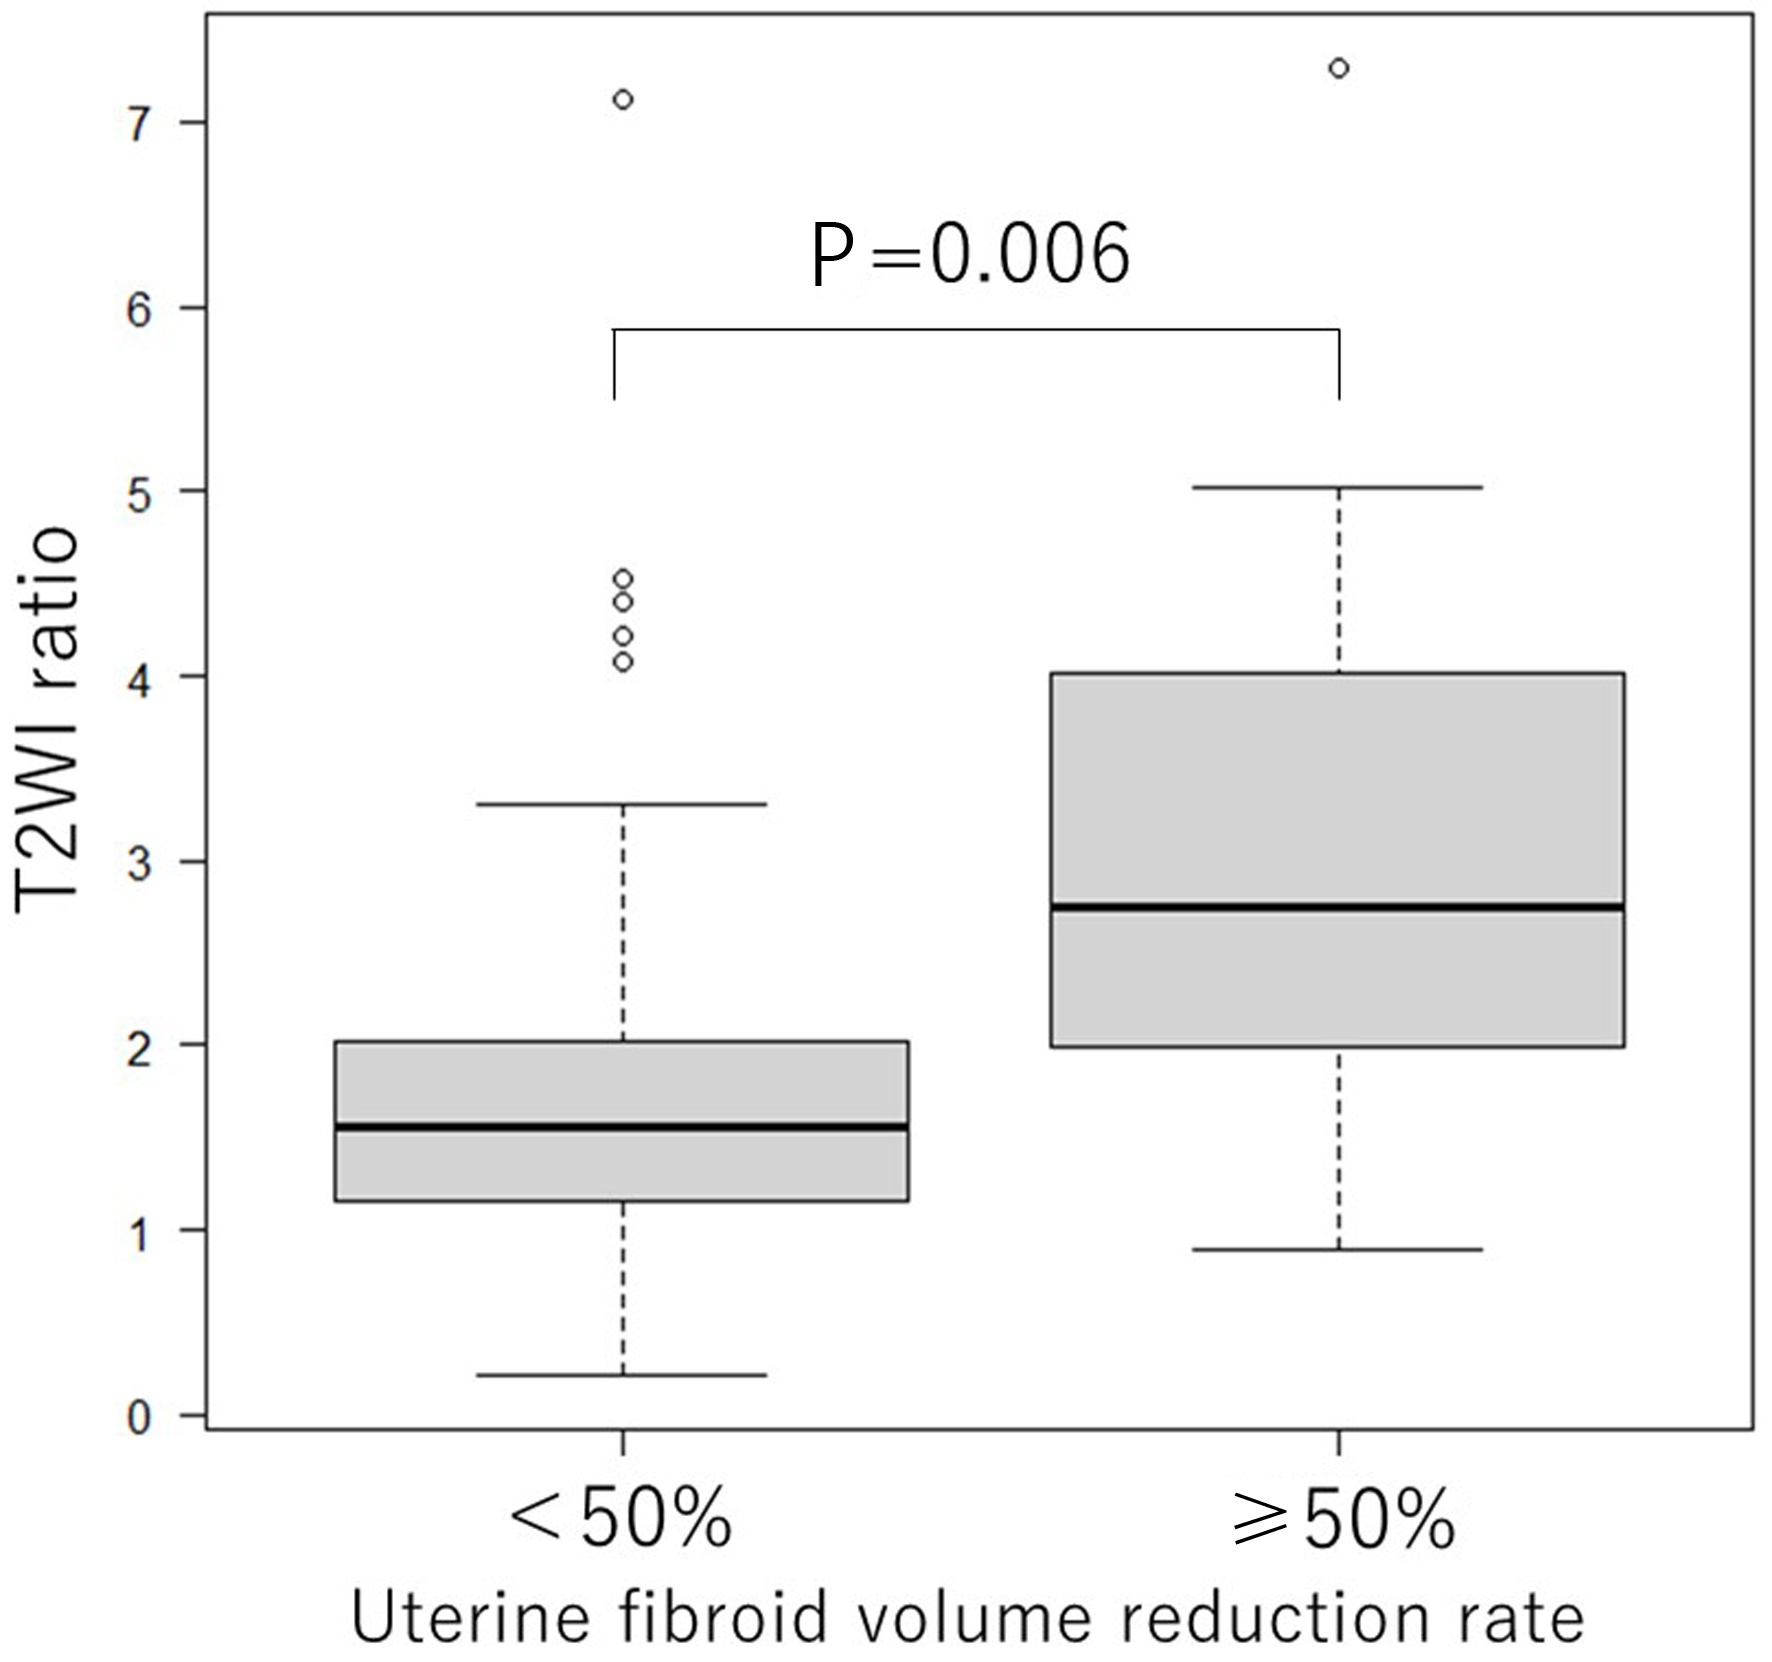
Figure 3. Boxplot comparing T2WI ratio by dividing uterine fibroid volume reduction rate by 50%. T2WI ratio is significantly larger in the group with a volume reduction of ≥ 50% compared to the group with a volume reduction of < 50% (P = 0.006). T2WI: T2-weighted image.
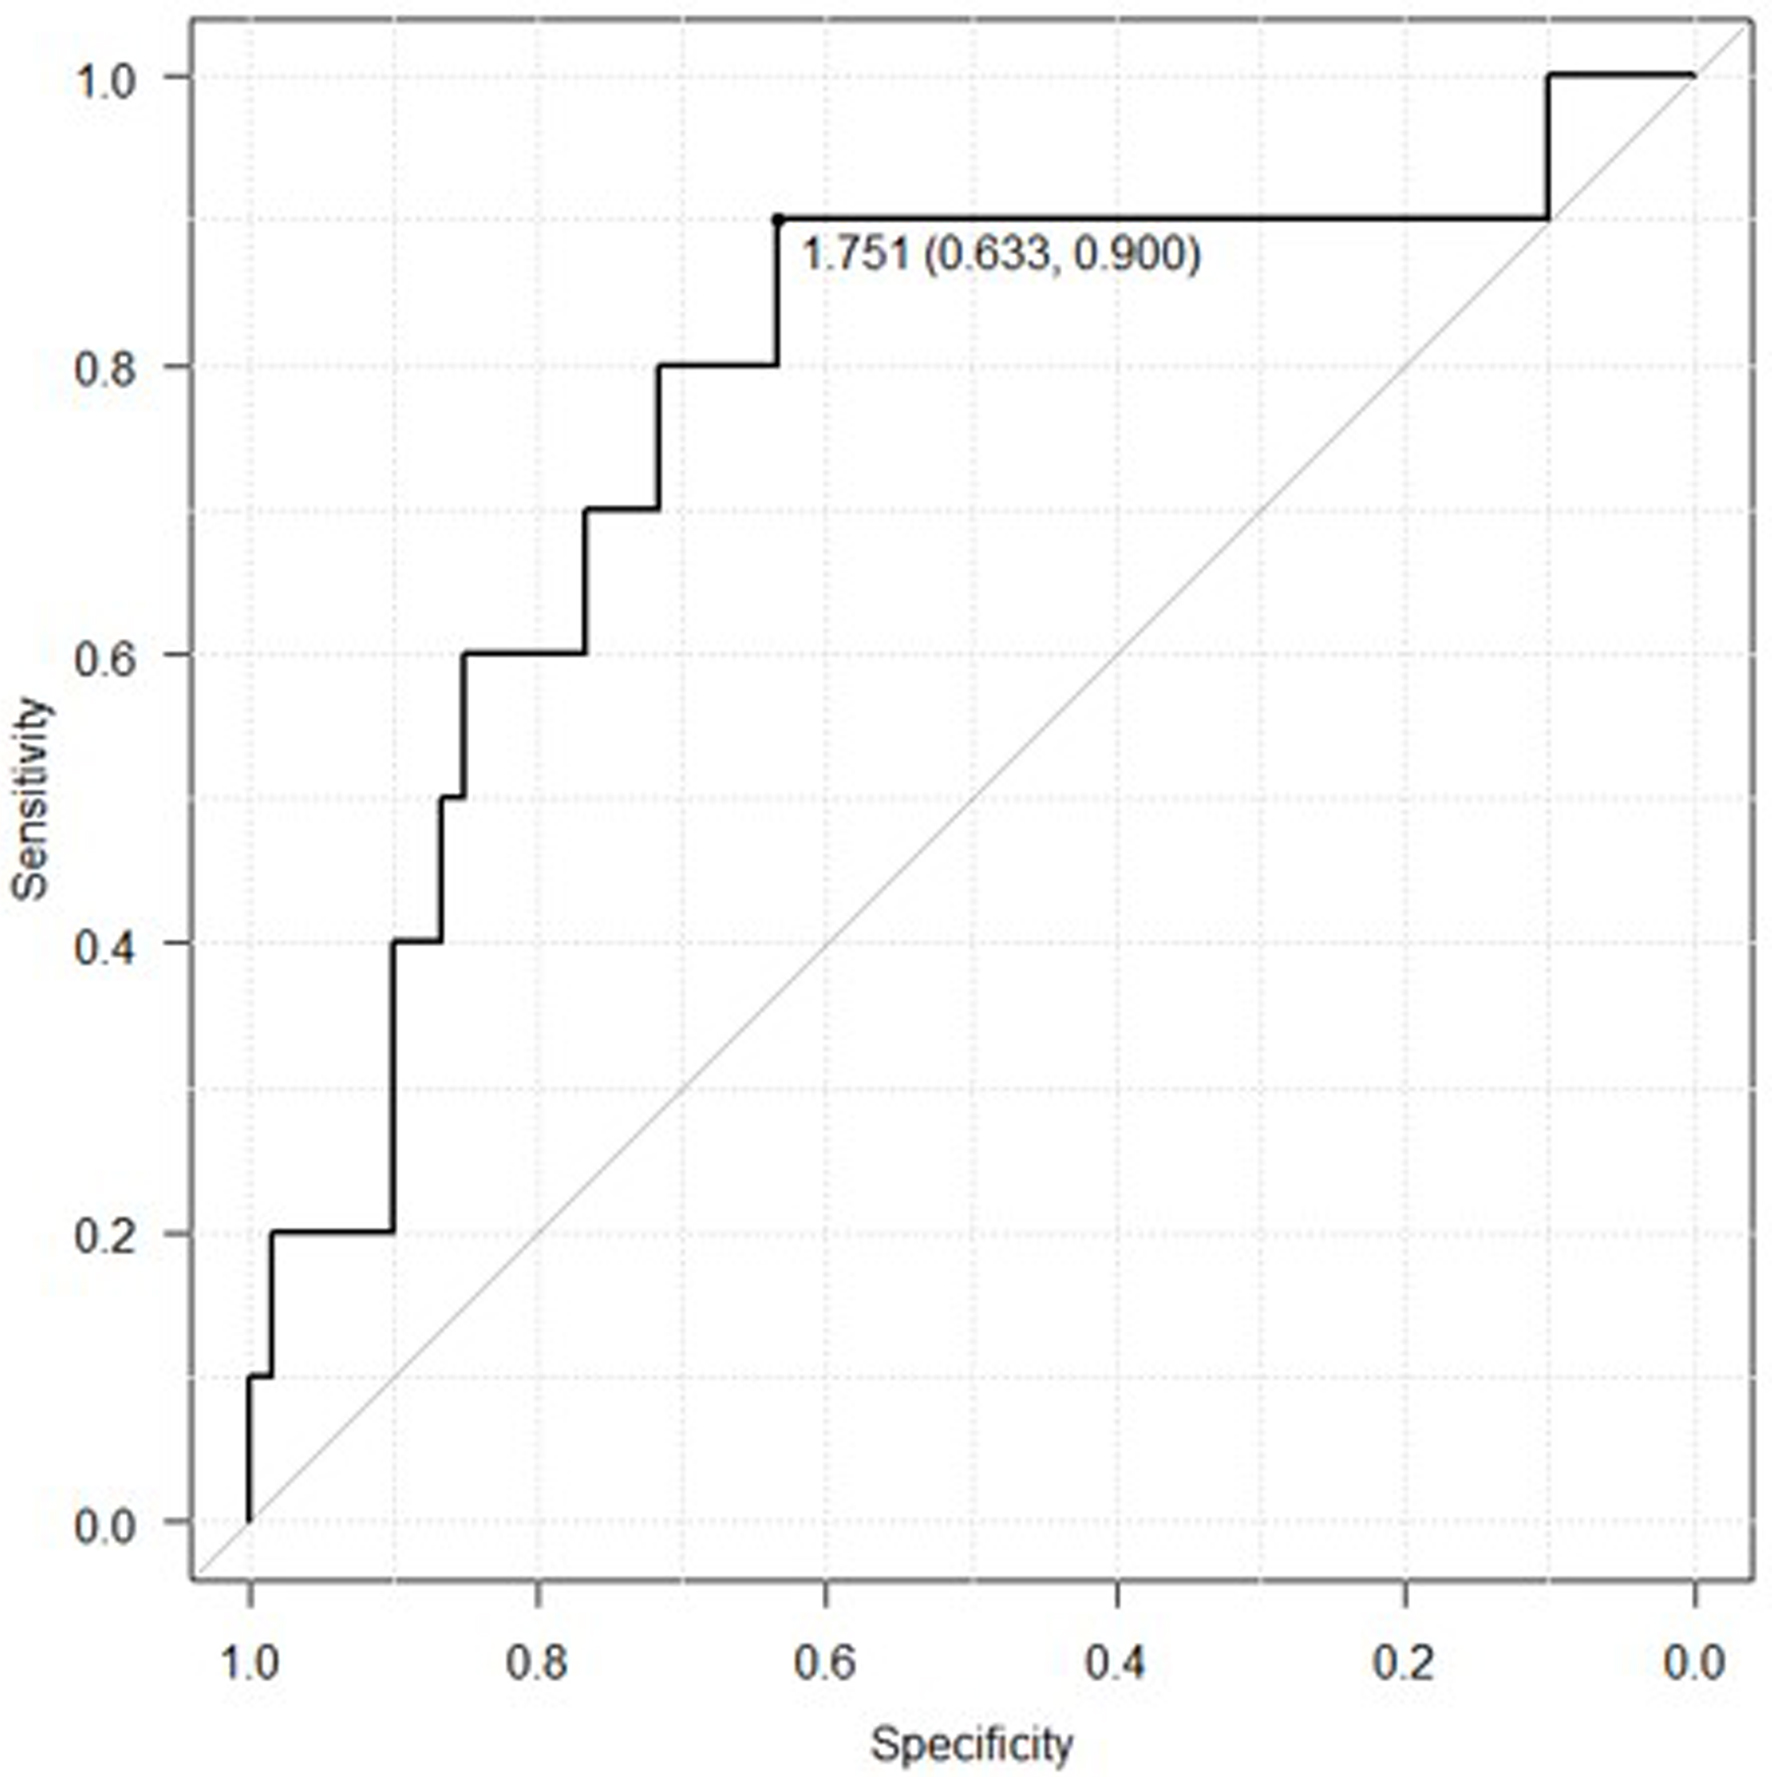
Figure 4. Receiver operating characteristic curve created by assuming that a fibroid volume reduction rate of 50% or more is effective (positive). The cut-off value was 1.751 and the area under the curve was 0.772 (95% CI, 0.598 - 0.945). CI: confidence interval.
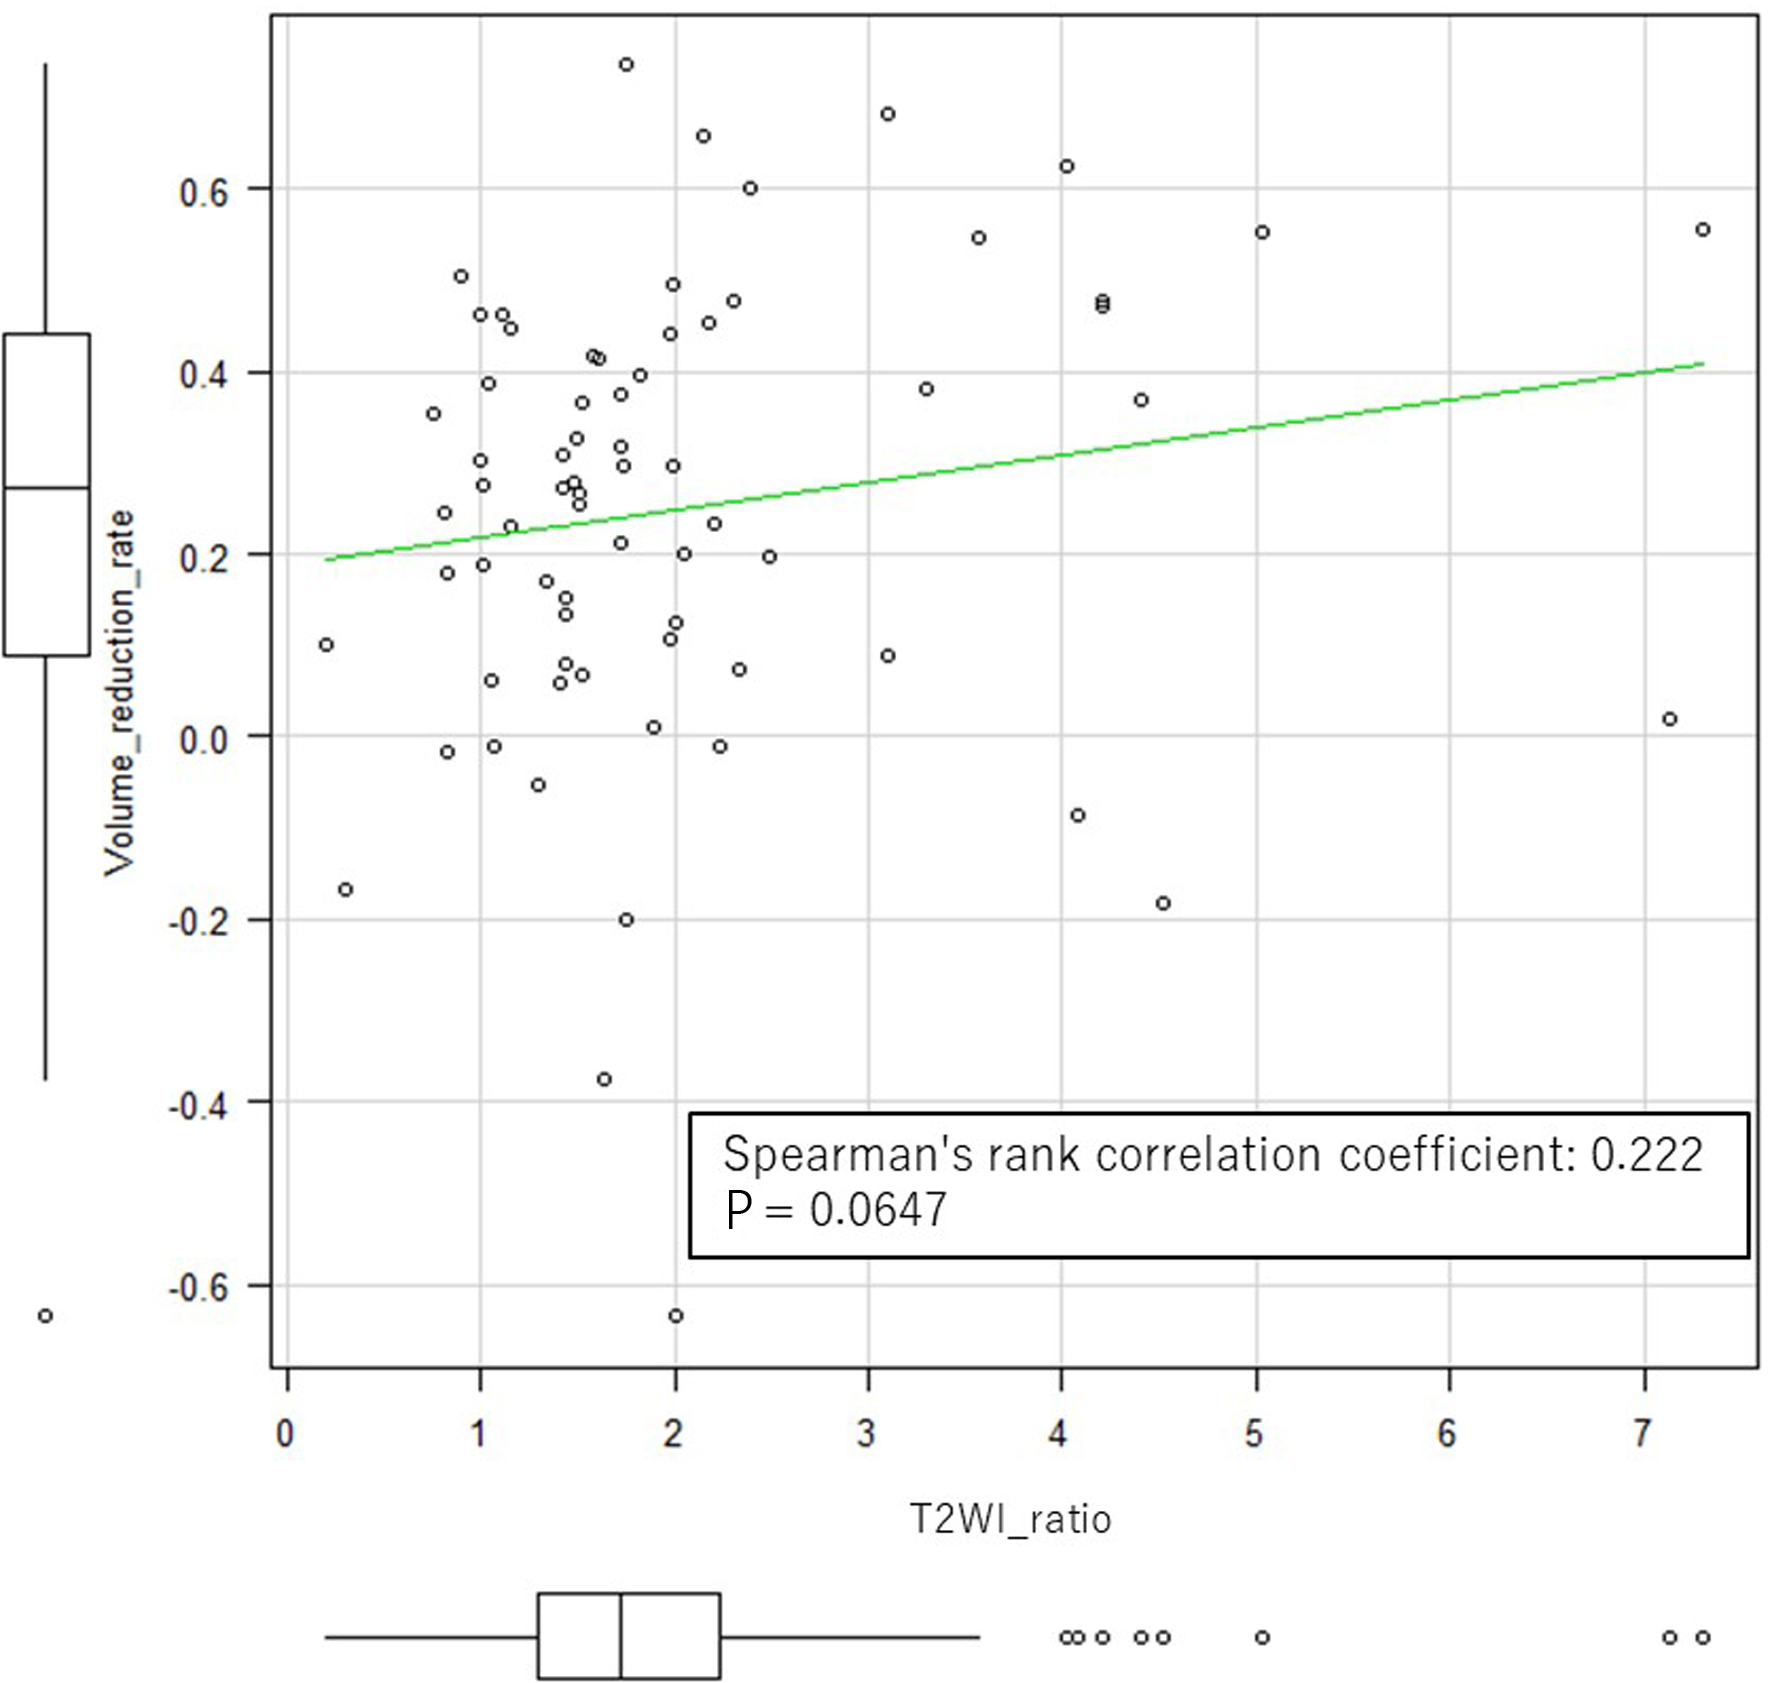
Figure 5. Spearman’s rank correlation coefficient determined for two continuous variables: the T2WI ratio and the rate of uterine fibroid volume reduction. T2WI: T2-weighted image.
Tables
Table 1. Characteristics of Uterine Fibroids Divided by Volume Reduction Rate of 50%
| < 50% | ≥ 50% | P |
|---|
| BMI: body mass index; IQR: interquartile range. |
| Number of uterine fibroids | 61 | 9 | - |
| Age, median (IQR) | 44.0 (38.0 - 46.0) | 44.0 (41.0 - 45.0) | 0.469 |
| BMI, median (IQR) | 23.0 (21.8 - 25.9) | 22.6 (21.6 - 25.4) | 0.586 |
| Gravidity, median (IQR) | 1.0 (0 - 2.0) | 2.0 (0 - 2.0) | 0.844 |
| Parity, median (IQR) | 1.0 (0 - 2.0) | 2.0 (0 - 2.0) | 0.400 |
| Number of days of relugolix administration, median (IQR) | 92.0 (84.0 - 112.0) | 101.0 (91.0 - 118.0) | 0.272 |
Table 2. Evaluation of Test Accuracy When T2-Weighted Image Ratio Cutoff Value Is Set to 1.751
| ≥ 50% | < 50% |
|---|
| T2WI: T2-weighted image. |
| T2WI ratio ≥ 1.751 | 9 | 22 |
| T2WI ratio < 1.751 | 1 | 38 |
| Sensitivity | 0.900 |
| Specificity | 0.633 |
| Positive predictive value | 0.290 |
| Negative predictive value | 0.97 |


